Ecosystems - Mechanisms that enhance and enable the flow of benefits from forest ecosystem services to the poor
Strengthening the mechanisms for valuing the ecosystem services provided by forests (E) and ensuring that equitable benefits accrue to the forest-dependent poor is an increasingly used pathway.
- Overview: Strengthening the ability of forest-dependent households to benefit from Payment for Ecosystem Services (PES) and nature-based tourism can be a way to reduce poverty as well as increasing environmental quality
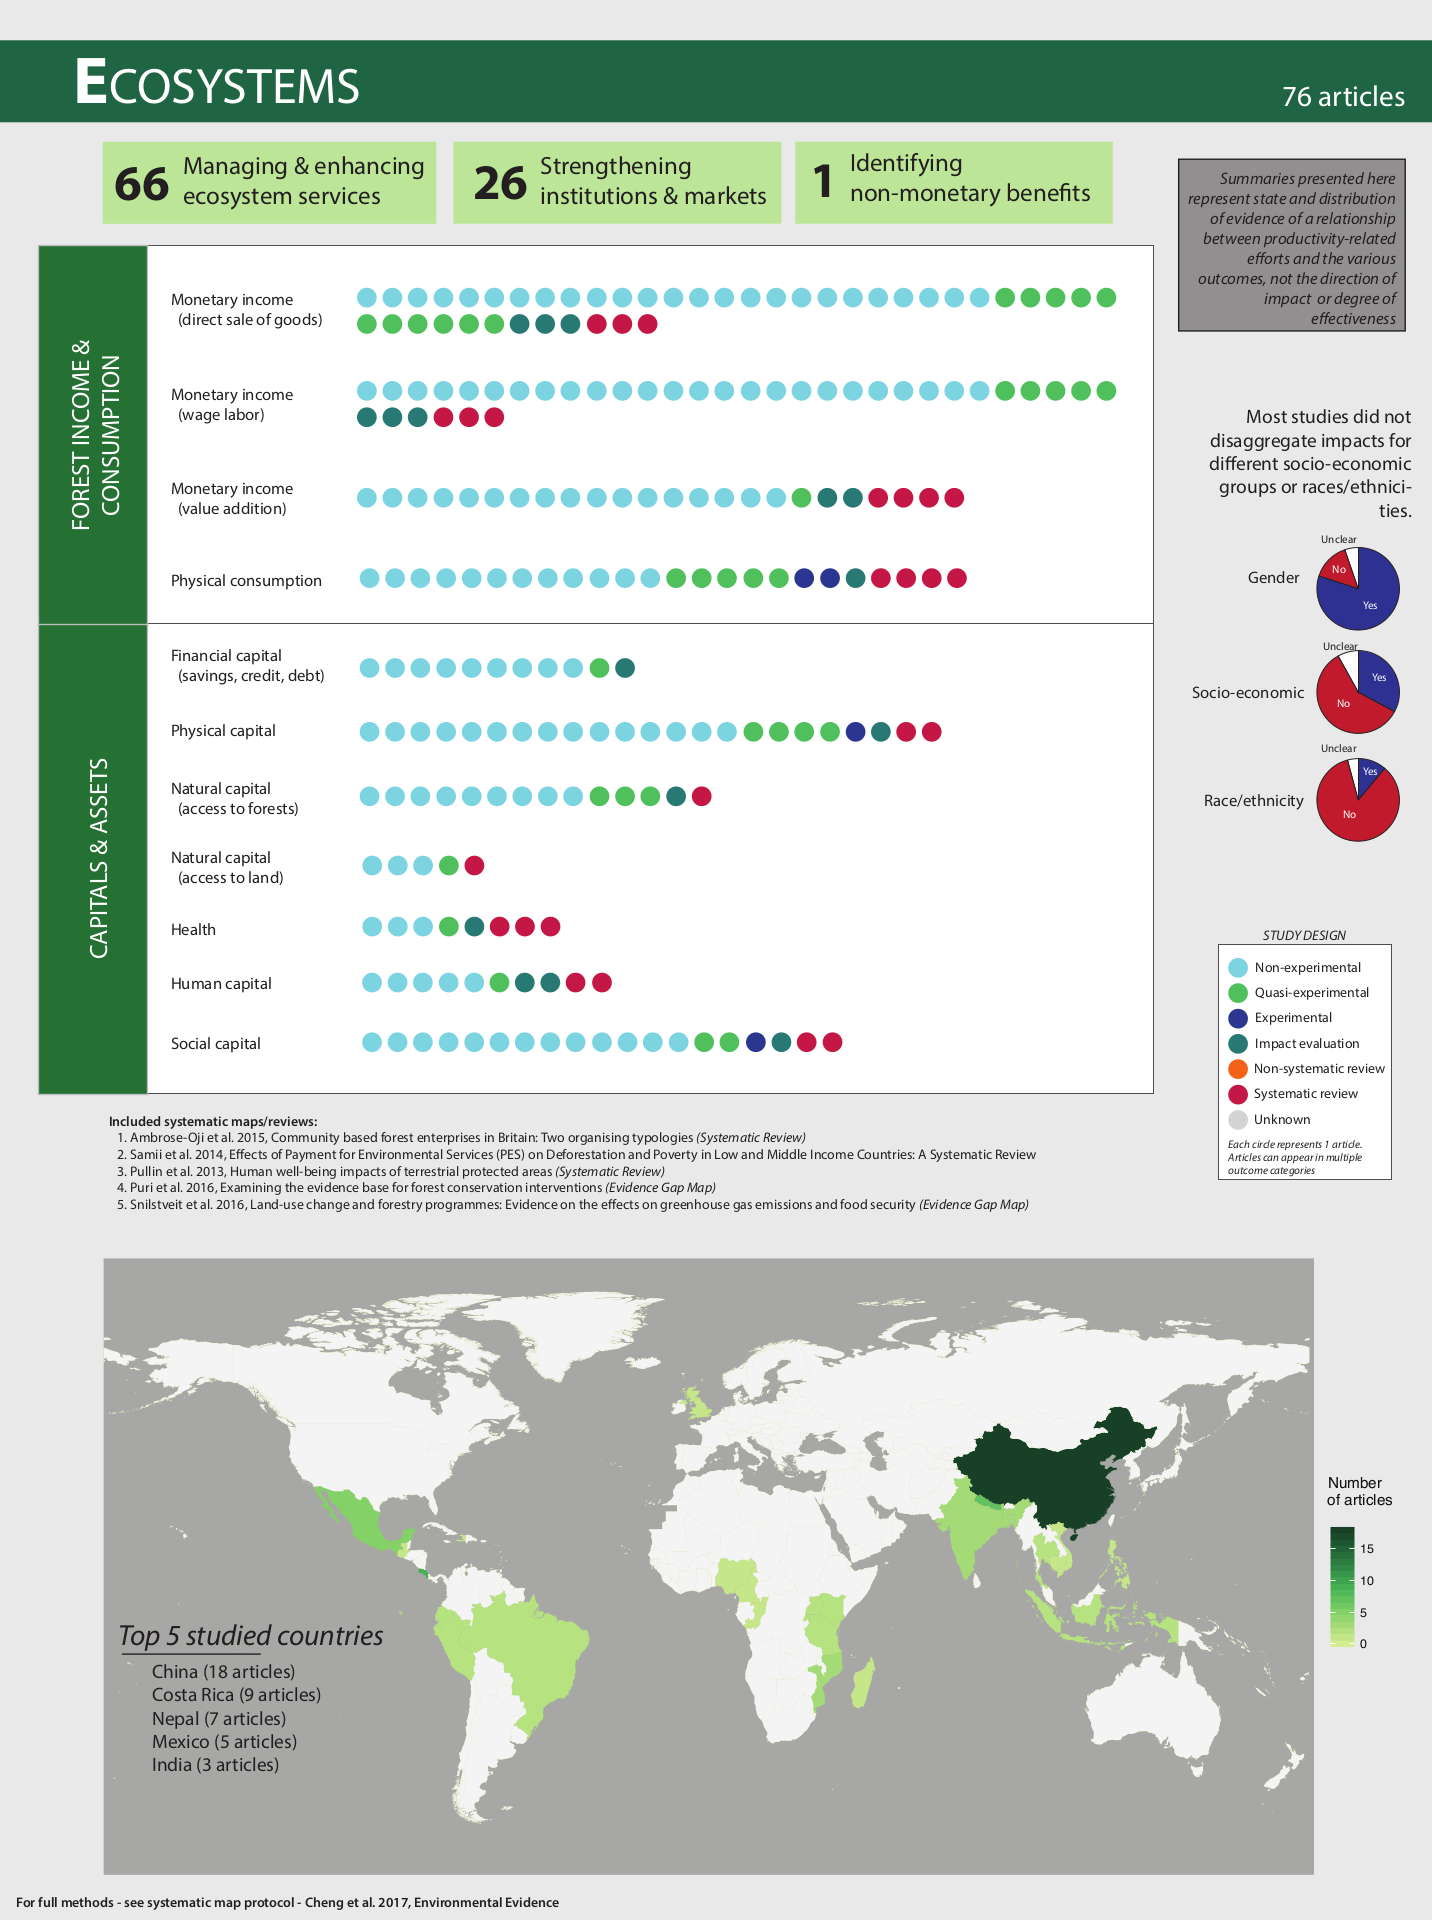
- Evidence map: Evidence primarily exists around the impact of ecosystem-related actions (improving ecosystem services management and enhancement, stronger institutions, and markets for ecosystem services) on income from direct sales of forest goods
- Country study: Mexico - World Bank-supported PES activities suggests that program design needs to address tenure insecurity (R) as well as opportunity costs for the poor to have an impact on poverty
- World Bank Portfolio Review: 38 percent of the sample included compensation for ecosystem services, a number that may increase in the future as carbon offset and PES markets emerged only in the latter half of the sample period
Overview
Forests provide critical ecosystem services, including water regulation and filtration, carbon sequestration, erosion control, pollination, biodiversity and storm protection (Canadell and Raupach 2008; Millenium Ecosystem Assessment (MEA) 2015). Many approaches aimed at conserving ecosystem services have implications for poverty reduction. A well-known market-driven approach to increase economic benefits from ecosystem services is nature-based tourism, which has emerged as a driver of growth in many developing economies (Hall 2007; Narain and Orfei 2012). There is now better evidence to suggest that protected area systems can contribute to poverty reduction. Regulating services from forests are also clearly important for maintaining not only livelihoods but also productivity in agriculture, agroforestry, hydropower and other sectors (Ricketts et al 2004).
An increasingly common strategy for managing ecosystem services is to construct markets that protect ecosystems while providing payments to local communities (Bulte et al 2008; Alix-Garcia and Wolff 2014). One such market is PES, which is now viewed not only as an instrument to manage natural areas but also to reduce rural poverty (Landell-Mill and Porras 2002; Pagiola et al 2005). A well-known global example of a PES program is REDD+, a forest-PES program for carbon capture and storage.
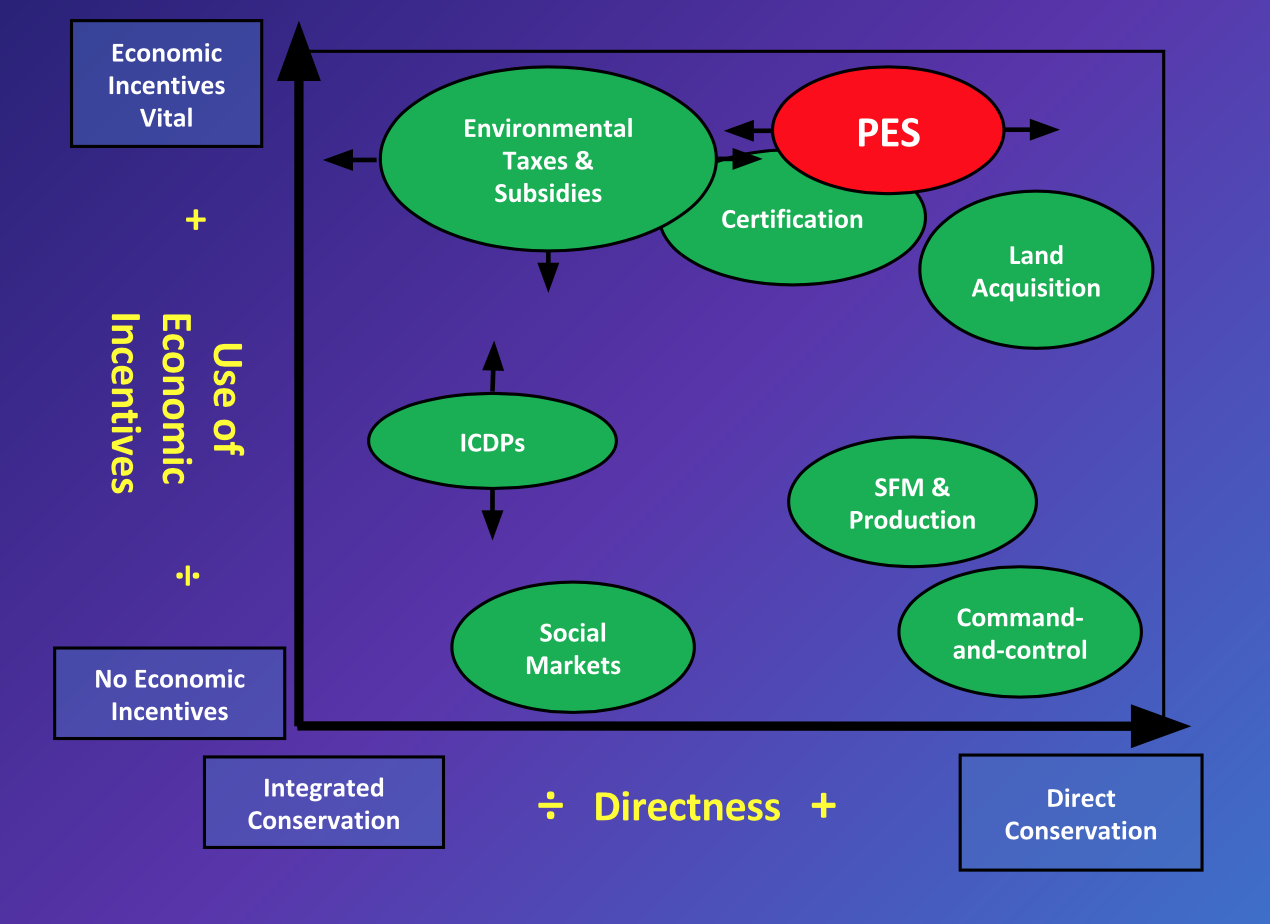
Scholars, however, caution that it takes careful design to achieve one, let alone two goals, with this one policy instrument (Alix-Garcia and Wolff 2014; Milder et al 2010; Wunder 2008). PES programs may choose to meet forest protection goals cost-effectively by targeting a few sellers of ecosystem services, a strategy that will likely favor payments to larger landowners. In addition, areas that deliver important ecosystem services may not overlap with where the poor live (Ferraro 2008; Fisher 2012; Robalino et al 2014). A case in point is China's Grain for Green program, which increased soil organic carbon (Song et al 2014), but with moderate impacts on poverty, possibly because the selection criteria prioritized off-site soil erosion rather than poverty reduction (Uchida et al 2007). In addition to such design issues, PES participation and the benefits accruing to the poor depend on household characteristics and the opportunity and transaction costs that households face (Pagiola et al 2005; Bulte et al 2008; Wunder 2008). Wunder 2008 states that participation in PES programs is determined by owning enough "environmentally strategic land"; trusting the purchaser; having sufficient capacity to meet program monitoring/production requirements; and that payments exceed opportunity costs.
Evidence Map Results
The evidence map identifies reports that 76 articles out of the 242 bring evidence on the links between actions related to ES management and enhancement, stronger institutions and markets for ES and welfare outcomes. This assessment highlighted evidence between these actions and monetary income through direct sales of forest goods and wage labor, but very little evidence with other types of capital.
Back to top
Illustrative Country Study
In Mexico, the World Bank is working with the government to finance one of the largest national ecosystem payments program in the world. Financed between 2003 and 2011 with a budget up to 489 million dollars, this program supported the conservation of 3.4 million ha (5.2%) of forests and targeted some 5,967 ejidos, communities and smallholders (CONAFOR 2011 in FAO 2013, Shapiro-Garza 2013 ).
World Bank Portfolio Review Results
Out of the total number of World Bank projects that met the criteria for inclusion in the portfolio analysis completed under this program (38), 15 (roughly 39%) contained forest ecosystems components as defined by the PRIME framework. These projects also contained other PRIME elements, showing the synergies and complementarities that exist among the components. For example, seven of the 15 ecosystems projects contained productivity components and 7 rights components; 11 also had investments components; and four markets components. Geographically, six forestry projects with ecosystems components were in the East Asia and Pacific (EAP) region, five in Sub-Saharan Africa (SSA), three in Latin American and the Caribbean (LAC) and one in Middle East and North Africa (MENA). The portfolio analysis completed under this program did not identify forestry projects containing ecosystems components in the Bank's Europe and Central Asian (ECA) region.
Split by
Color by