×

Indian Smart Cities


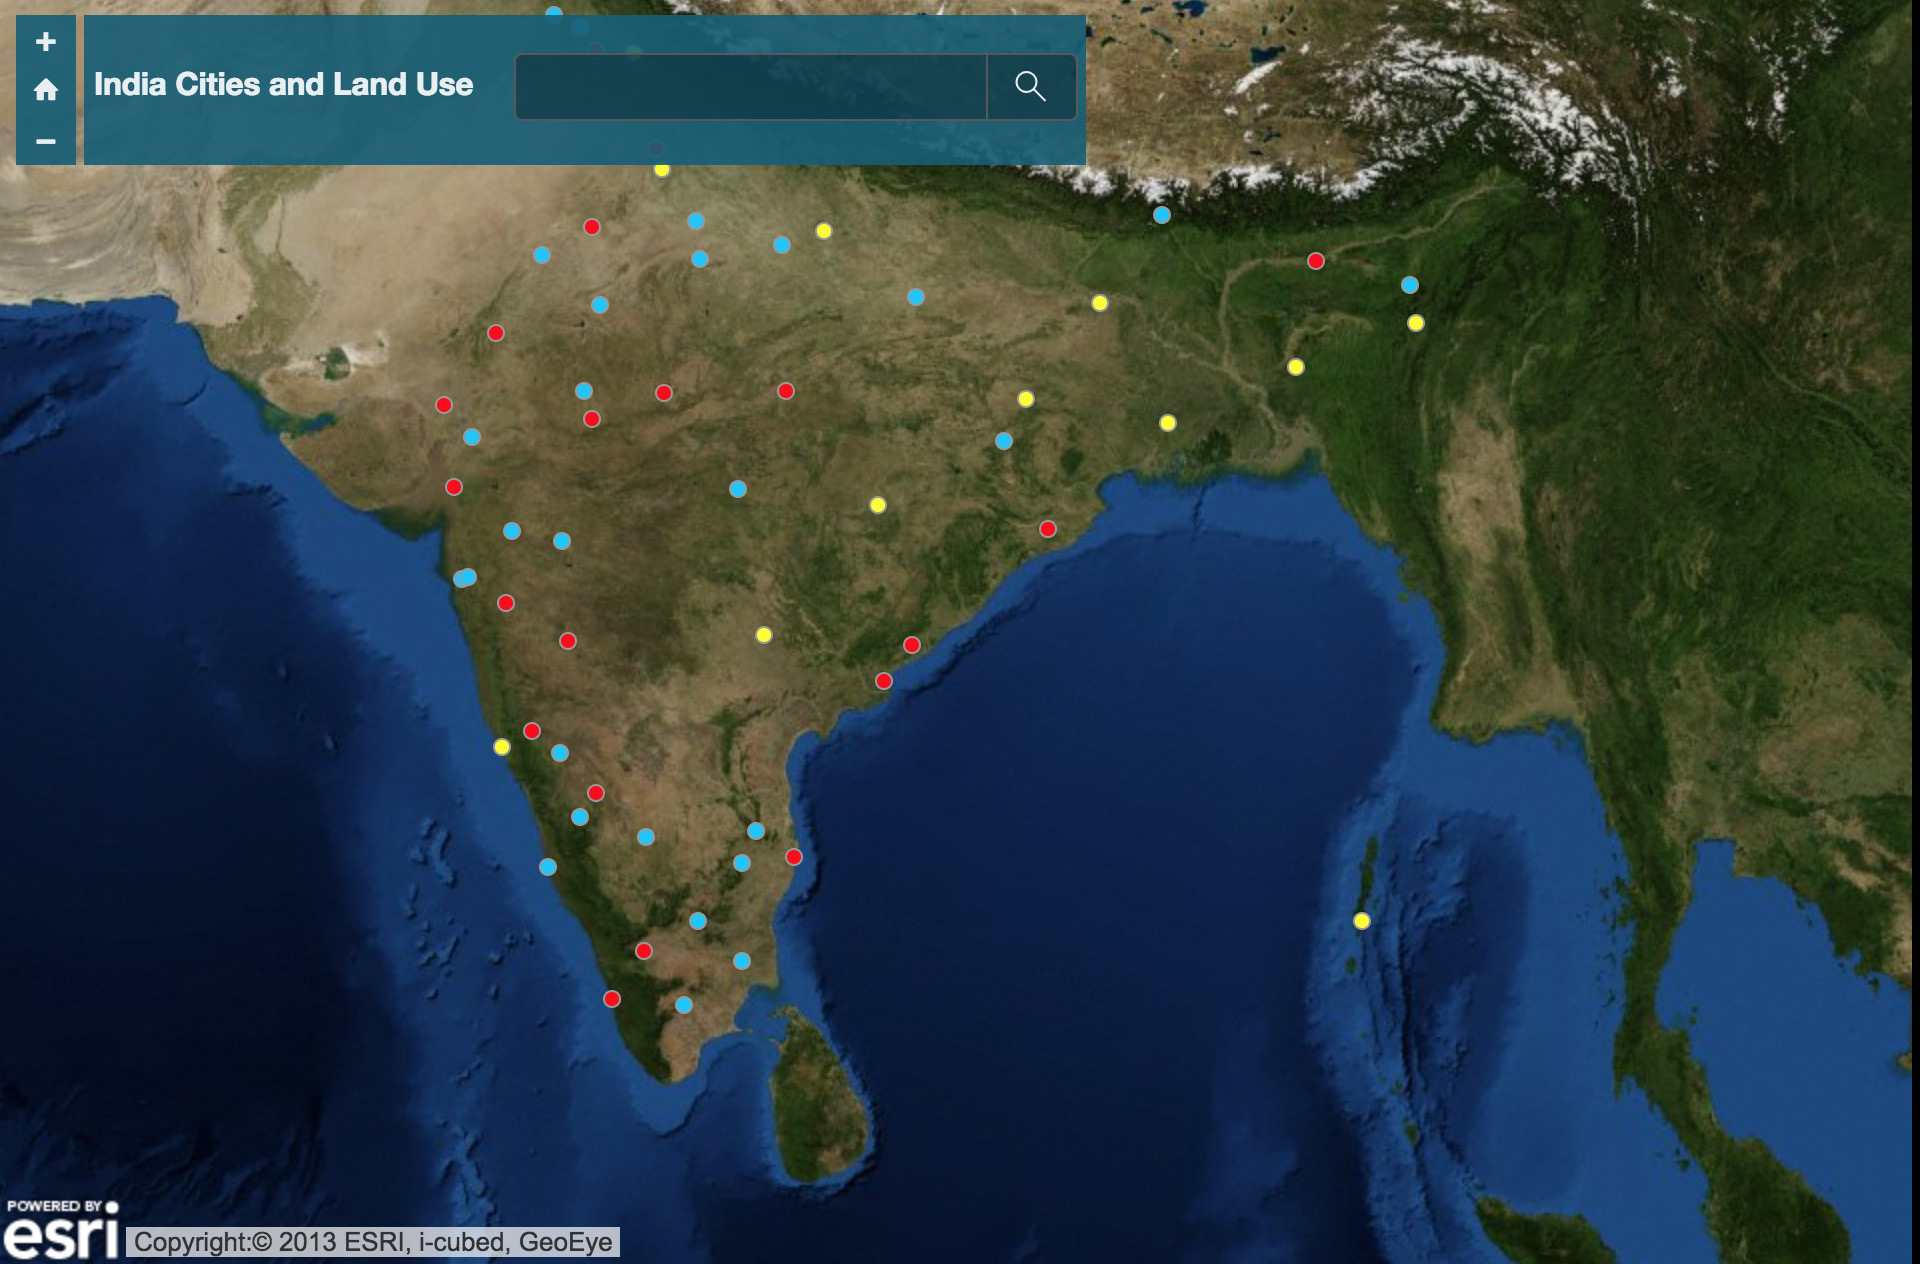
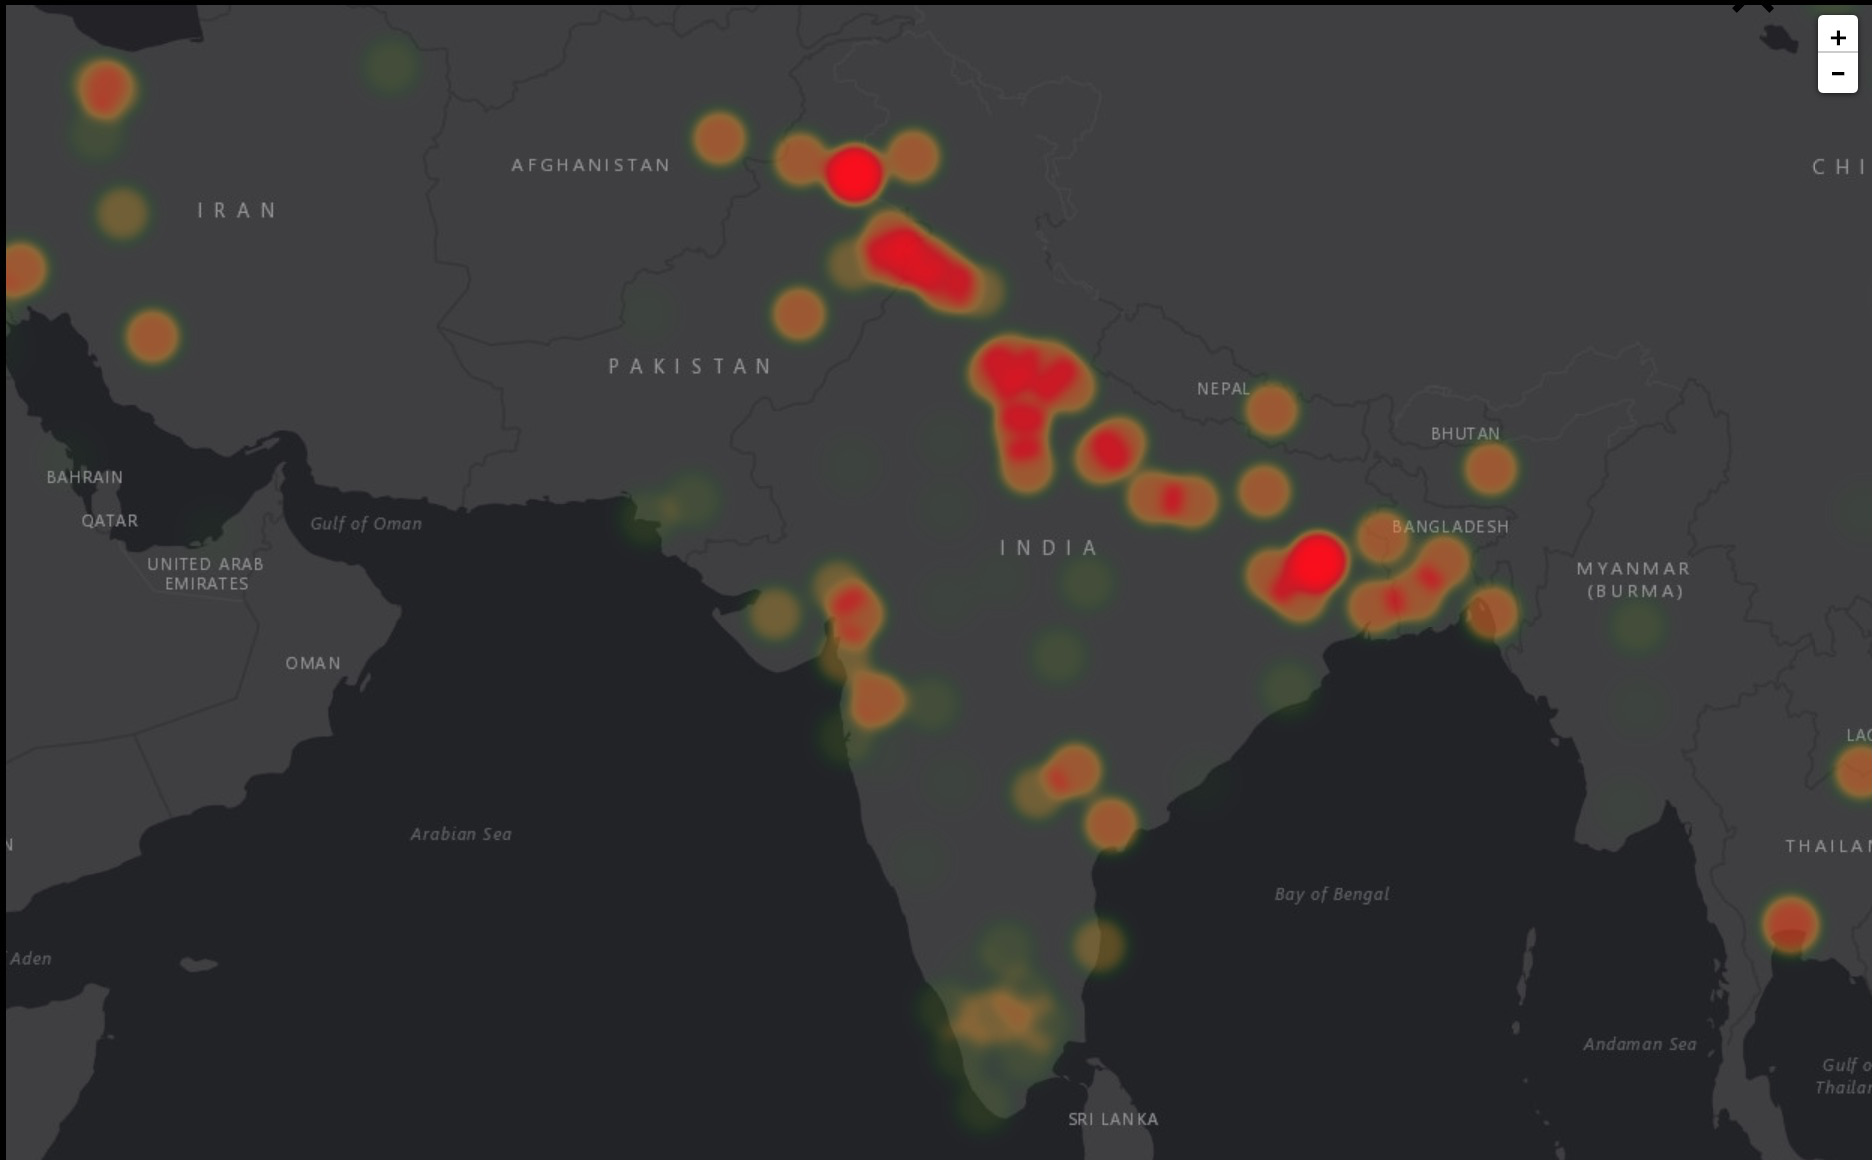
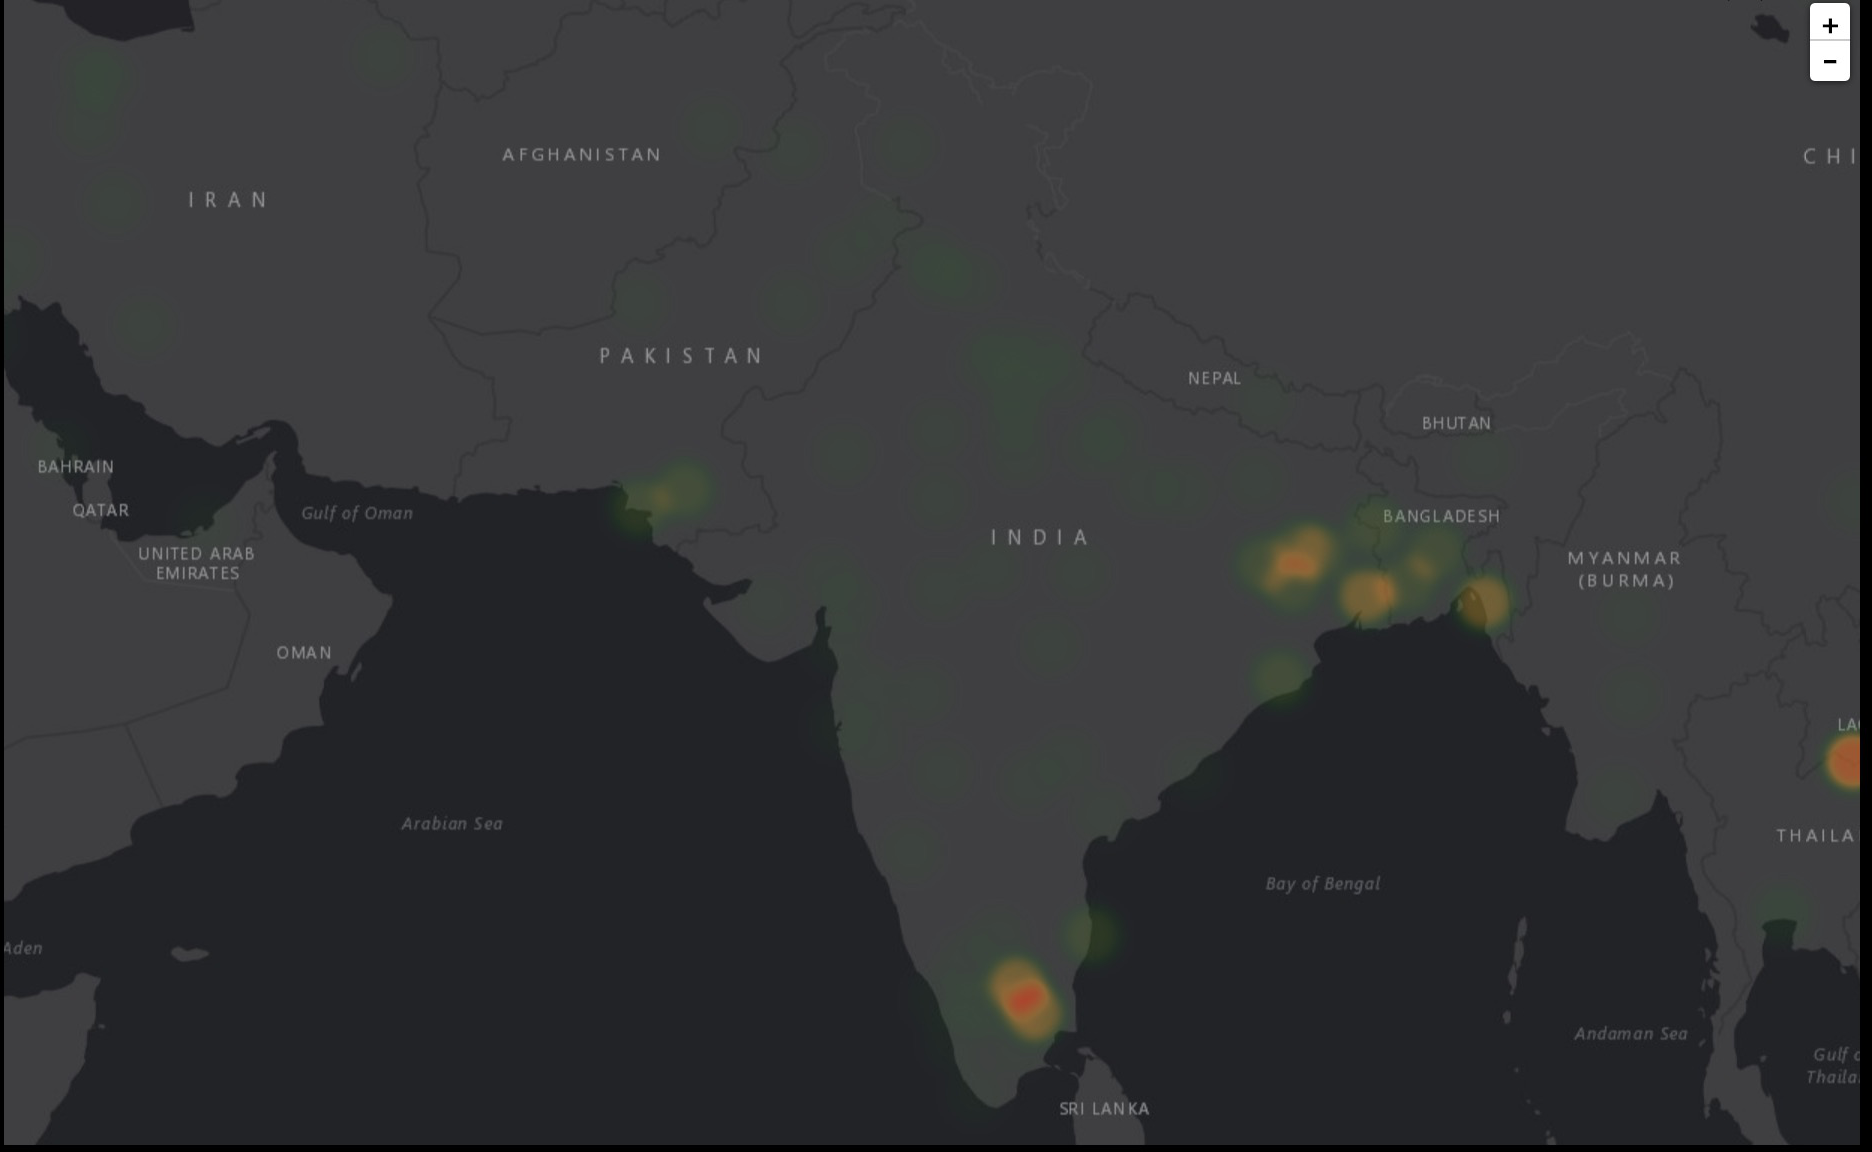
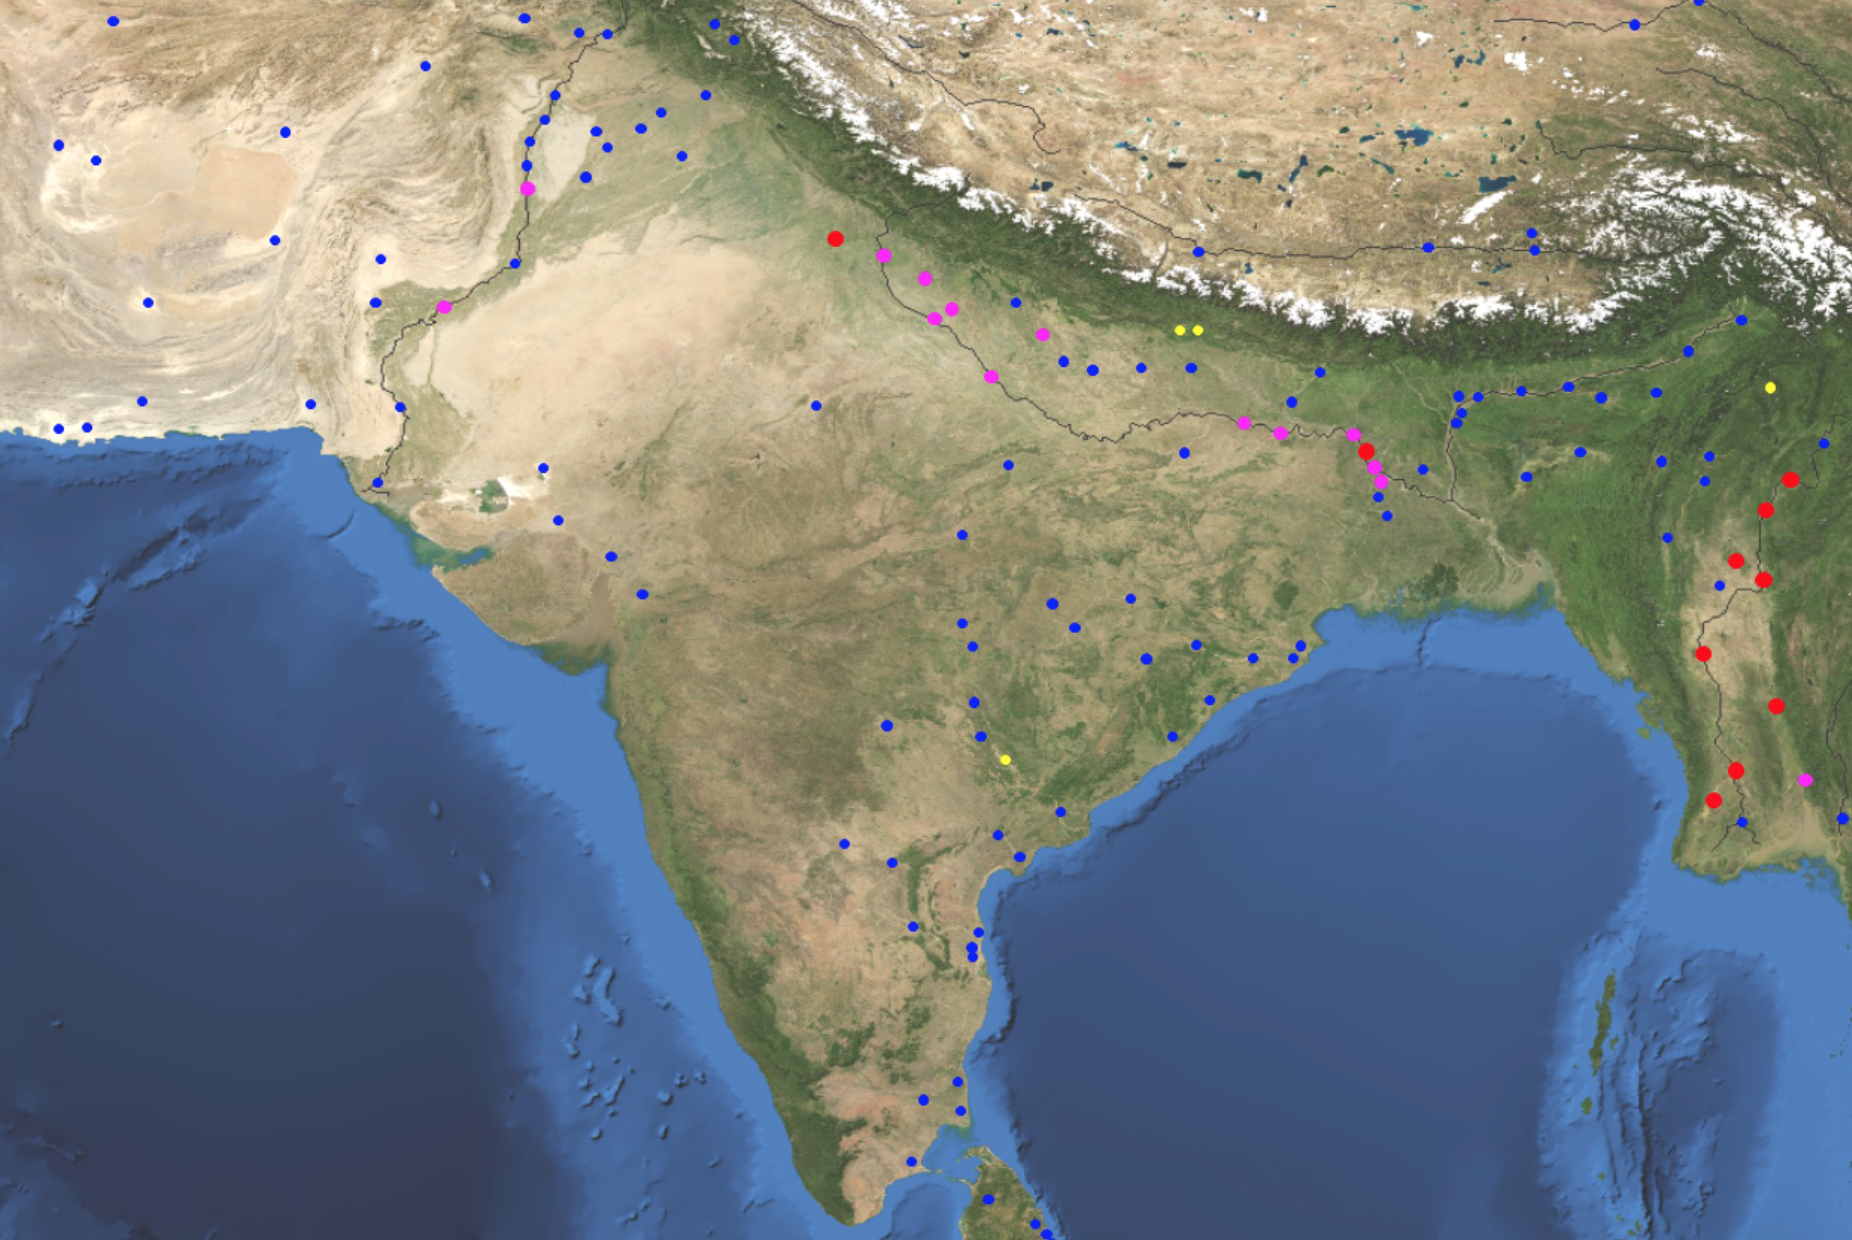
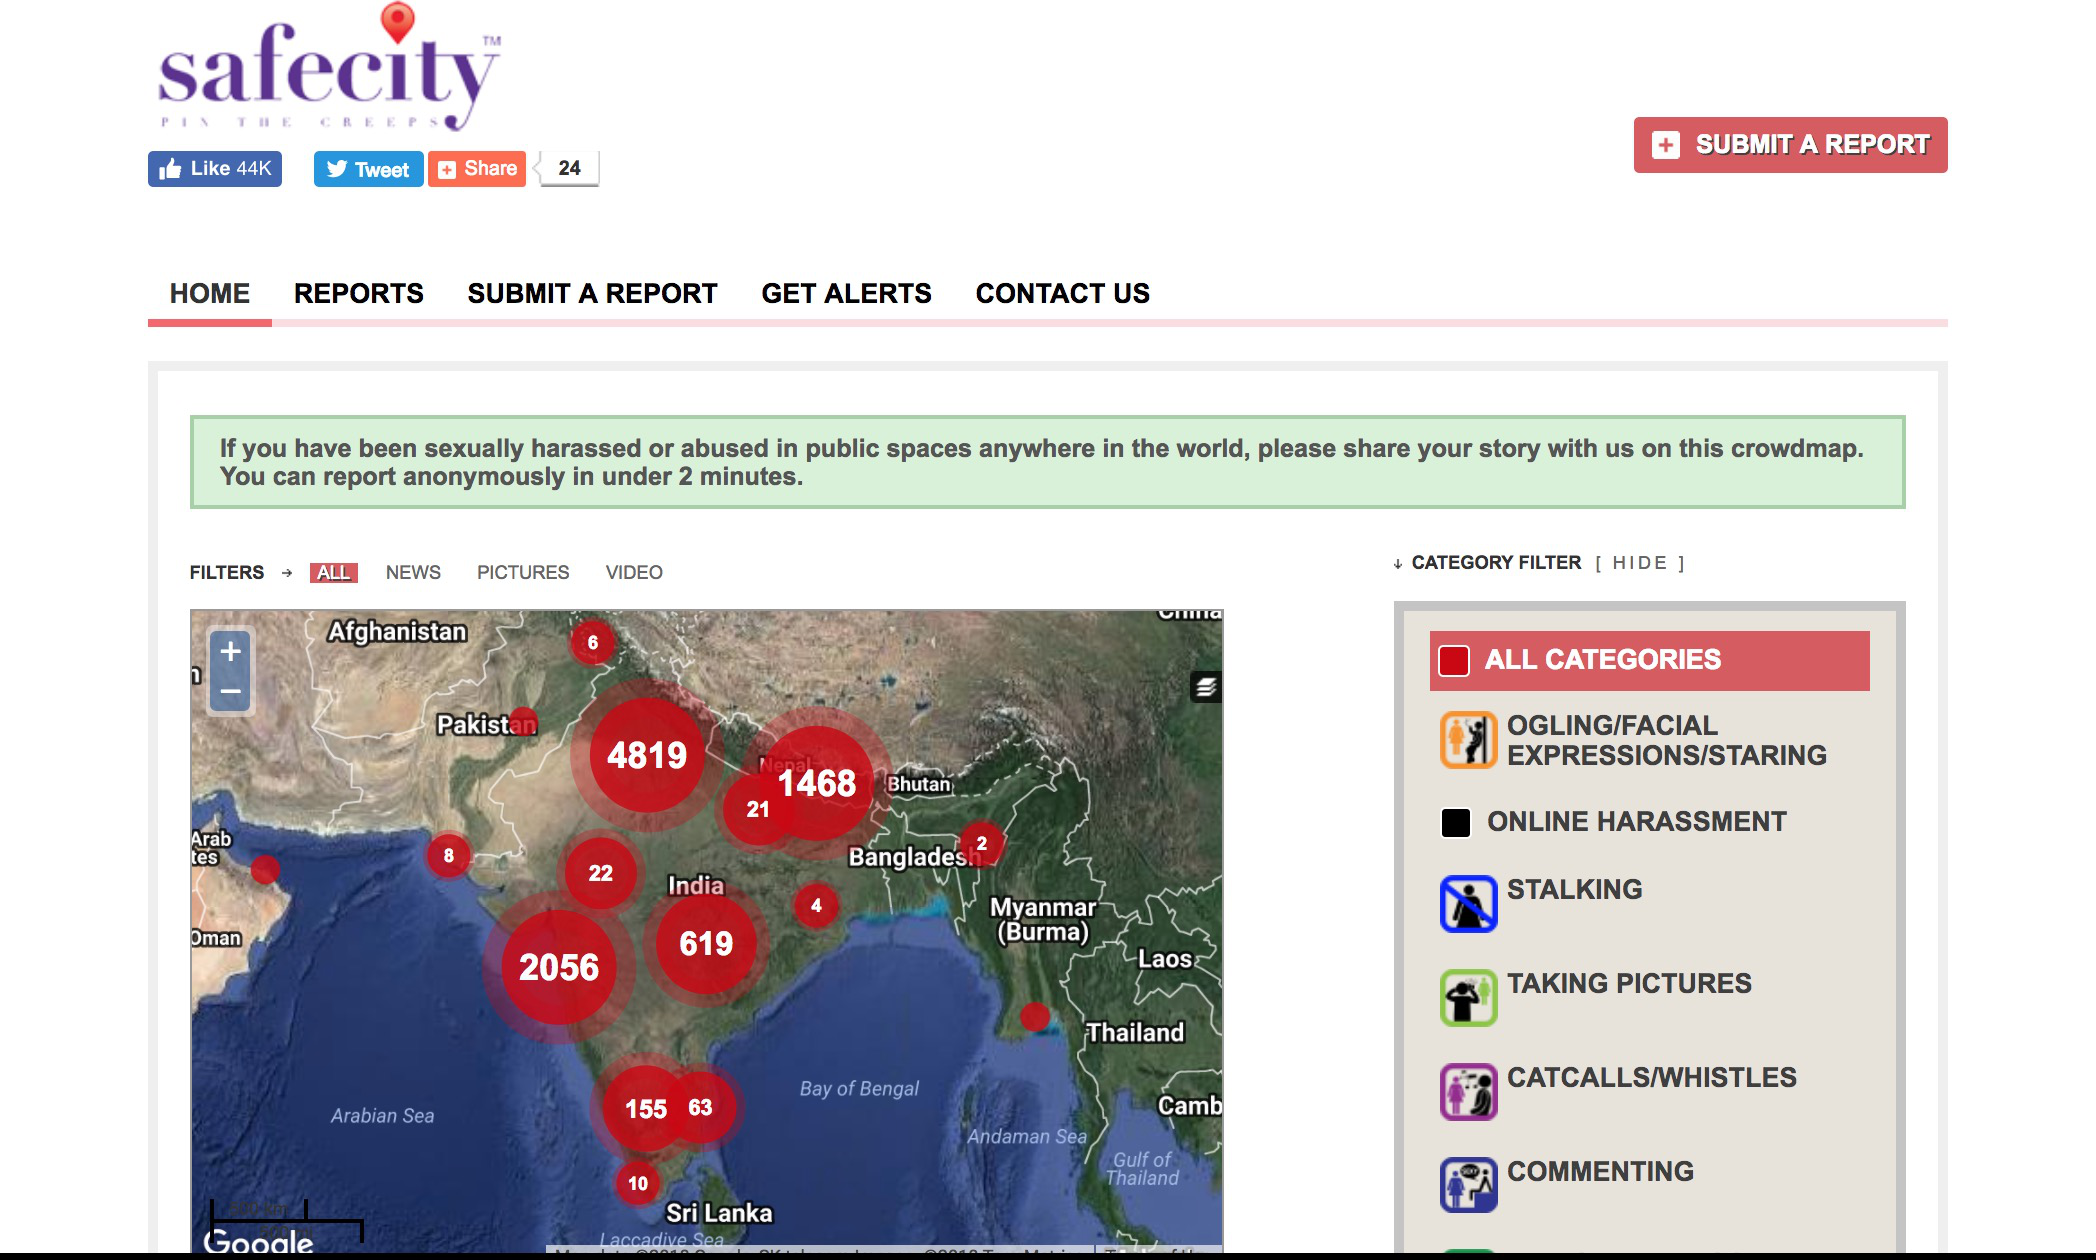
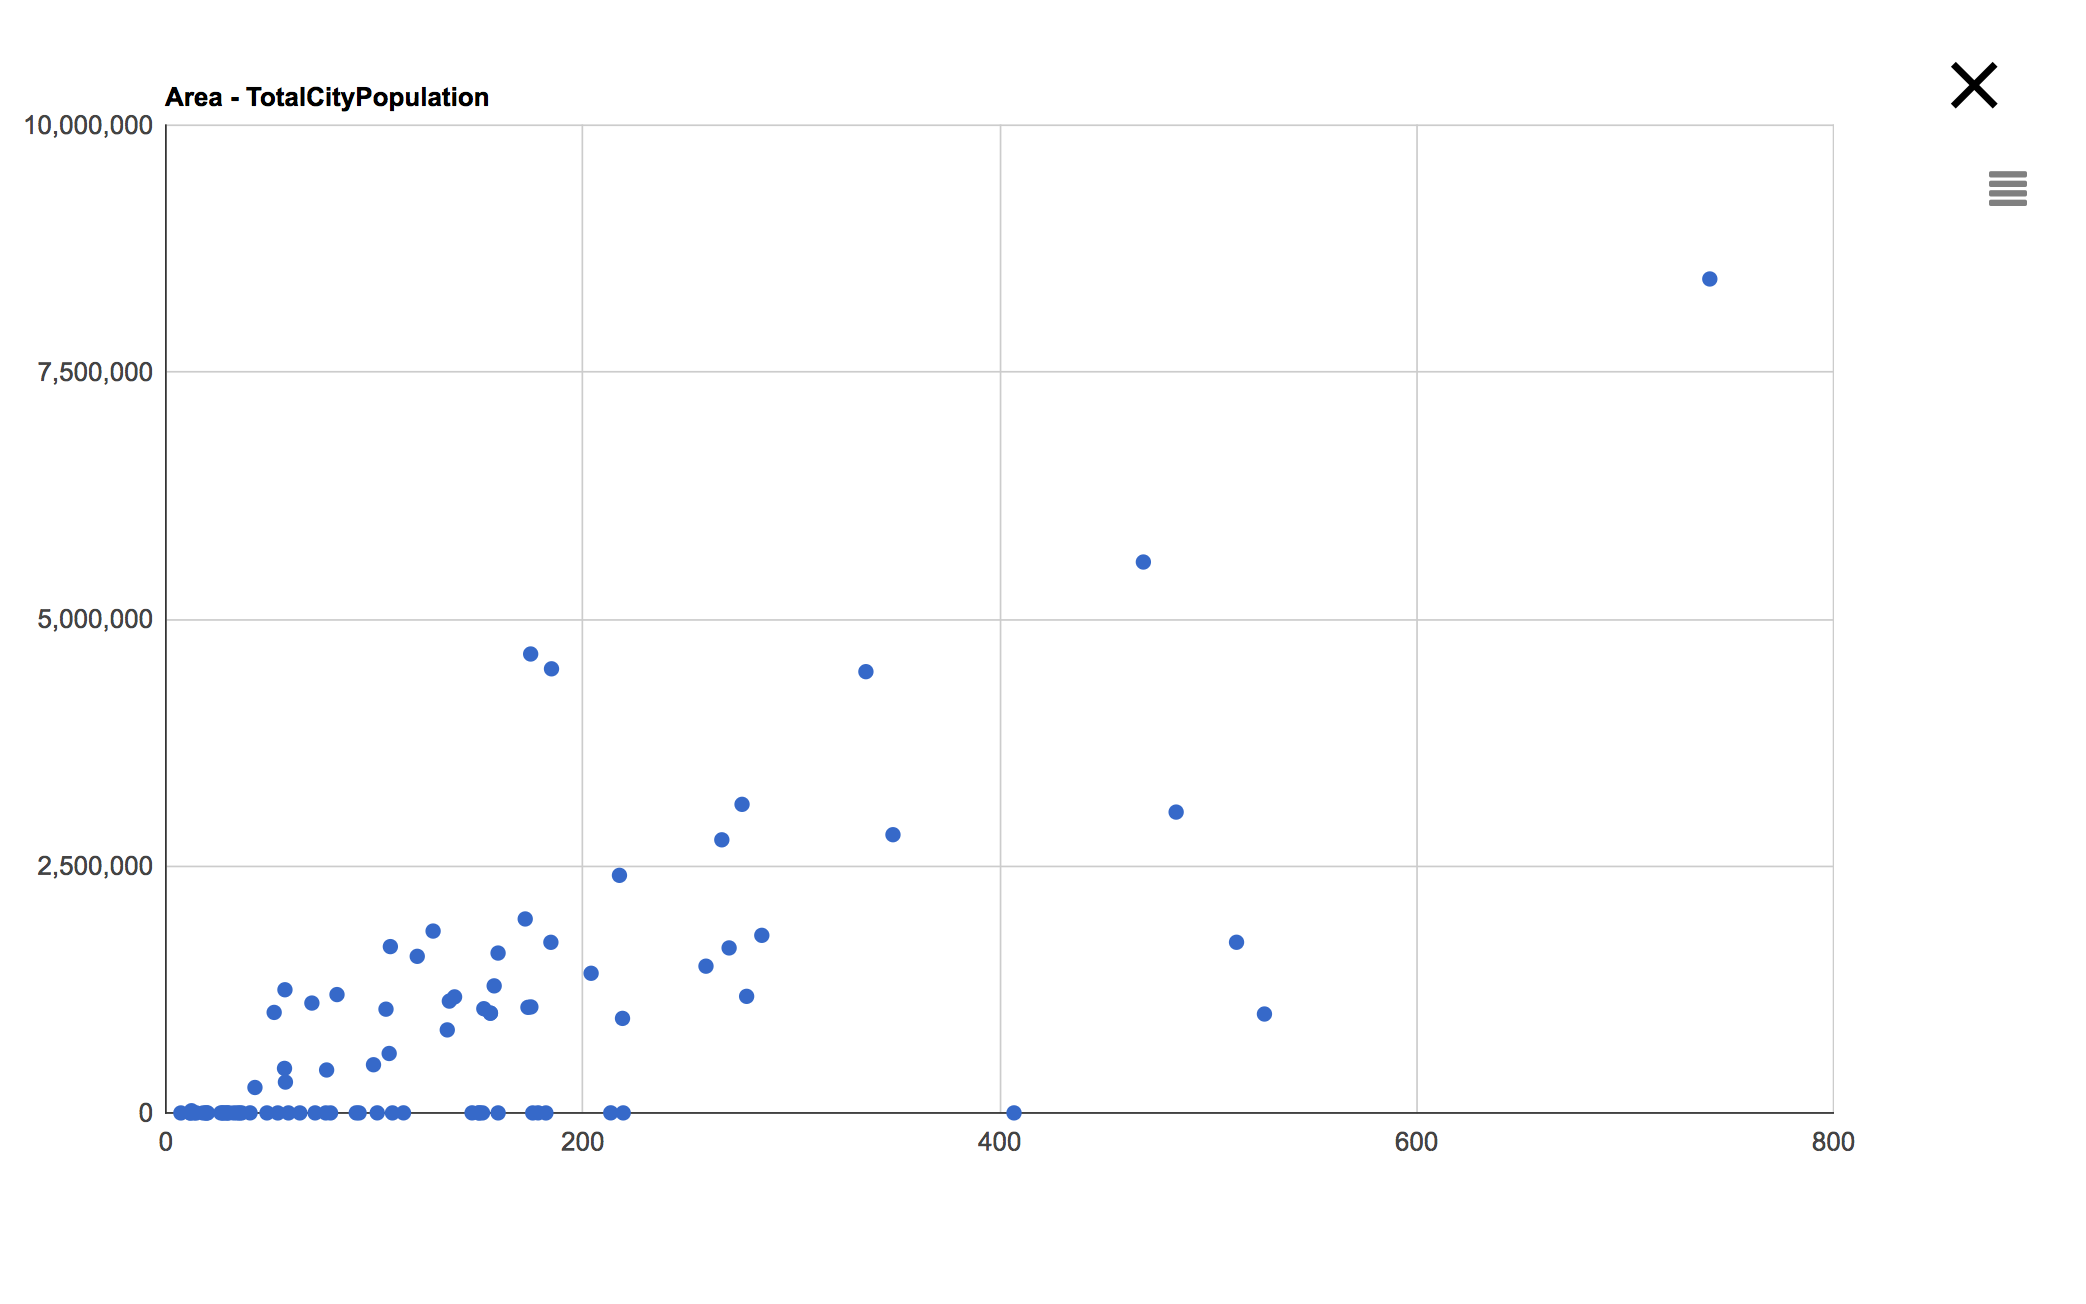
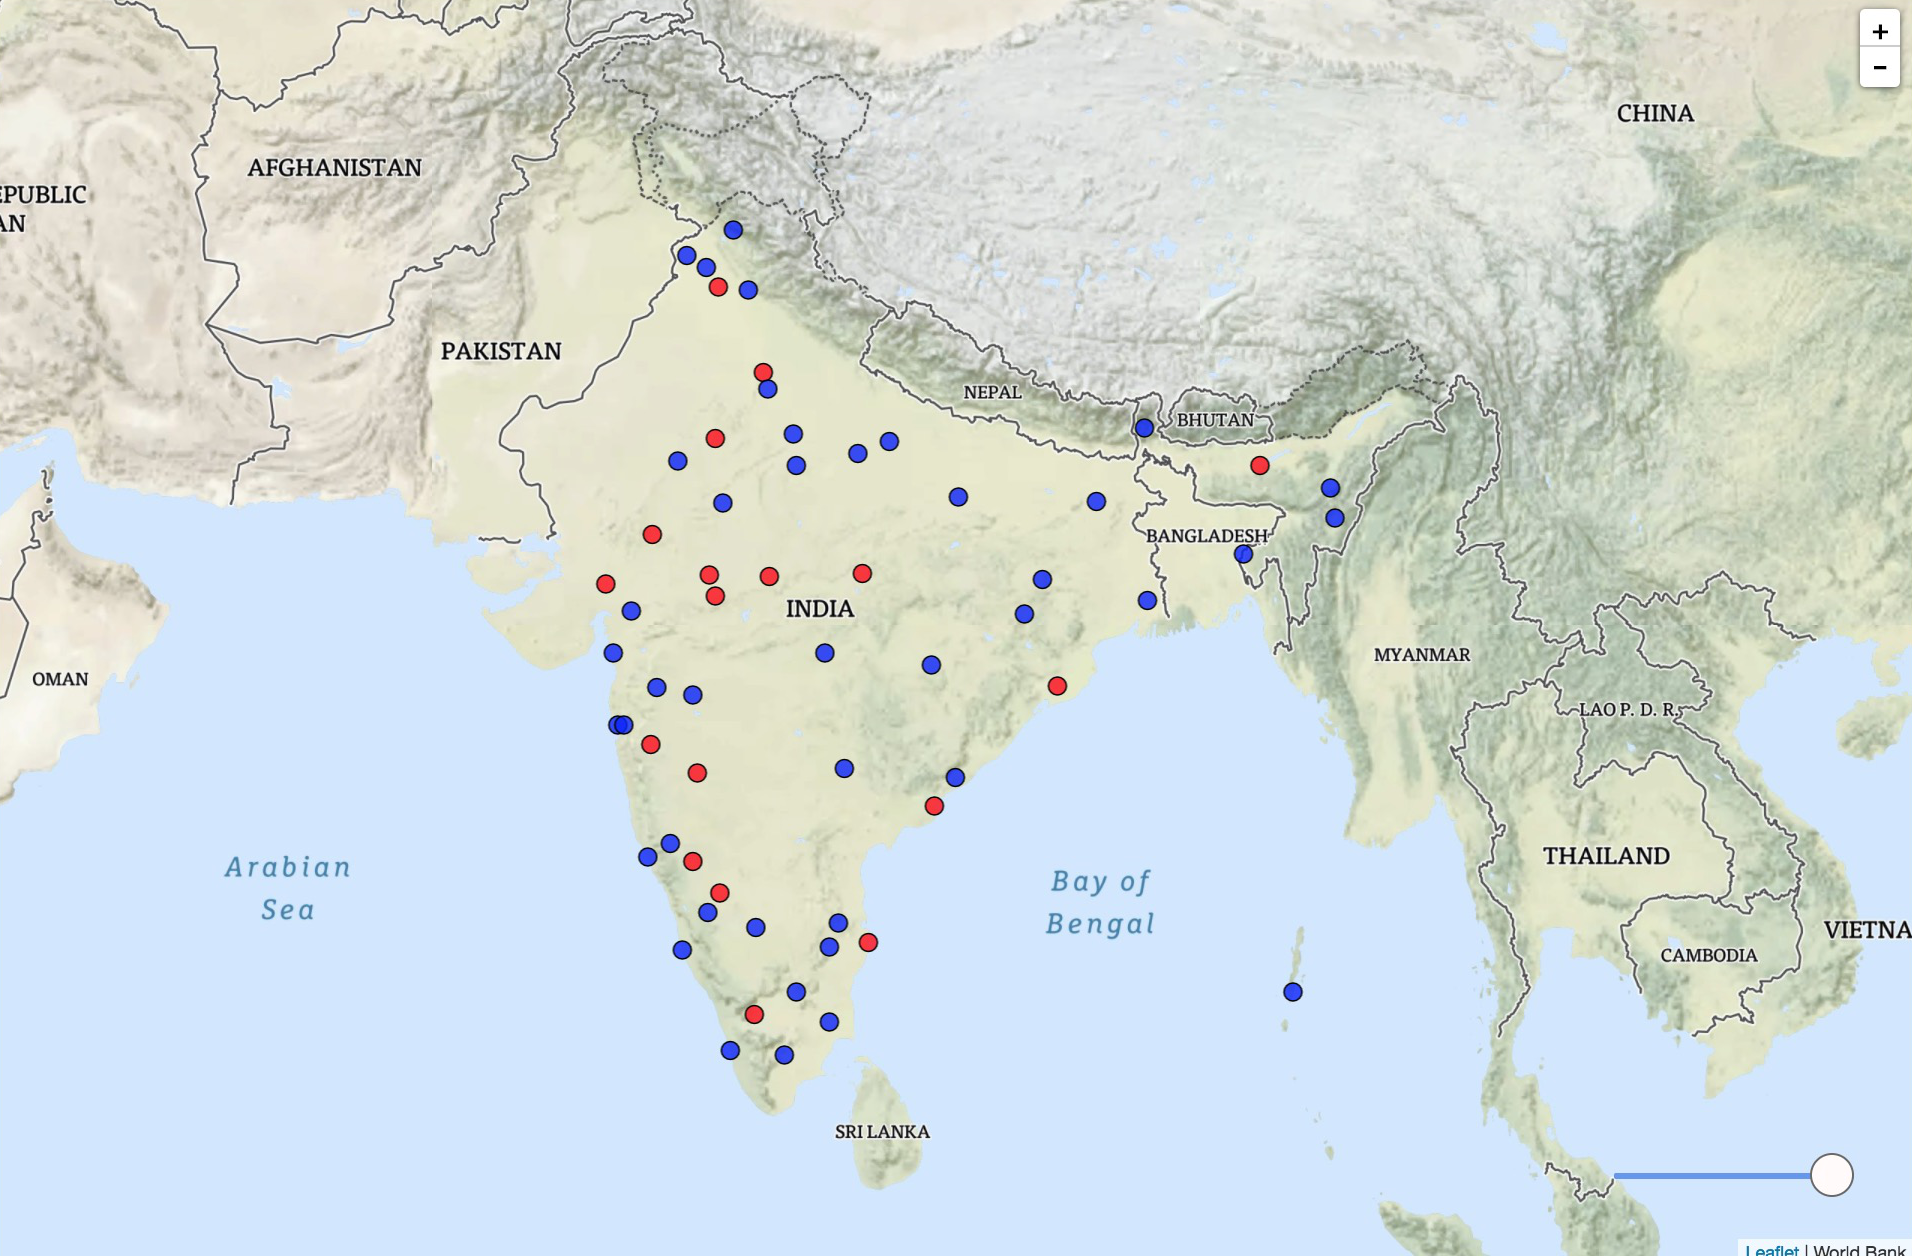
India has rapidly increasing urbanization and has embarked on a Smart City program. About 64 cities are currently part of this program (eventually expected to grow to 100 Smart Cities) as shown in the interactive map above:

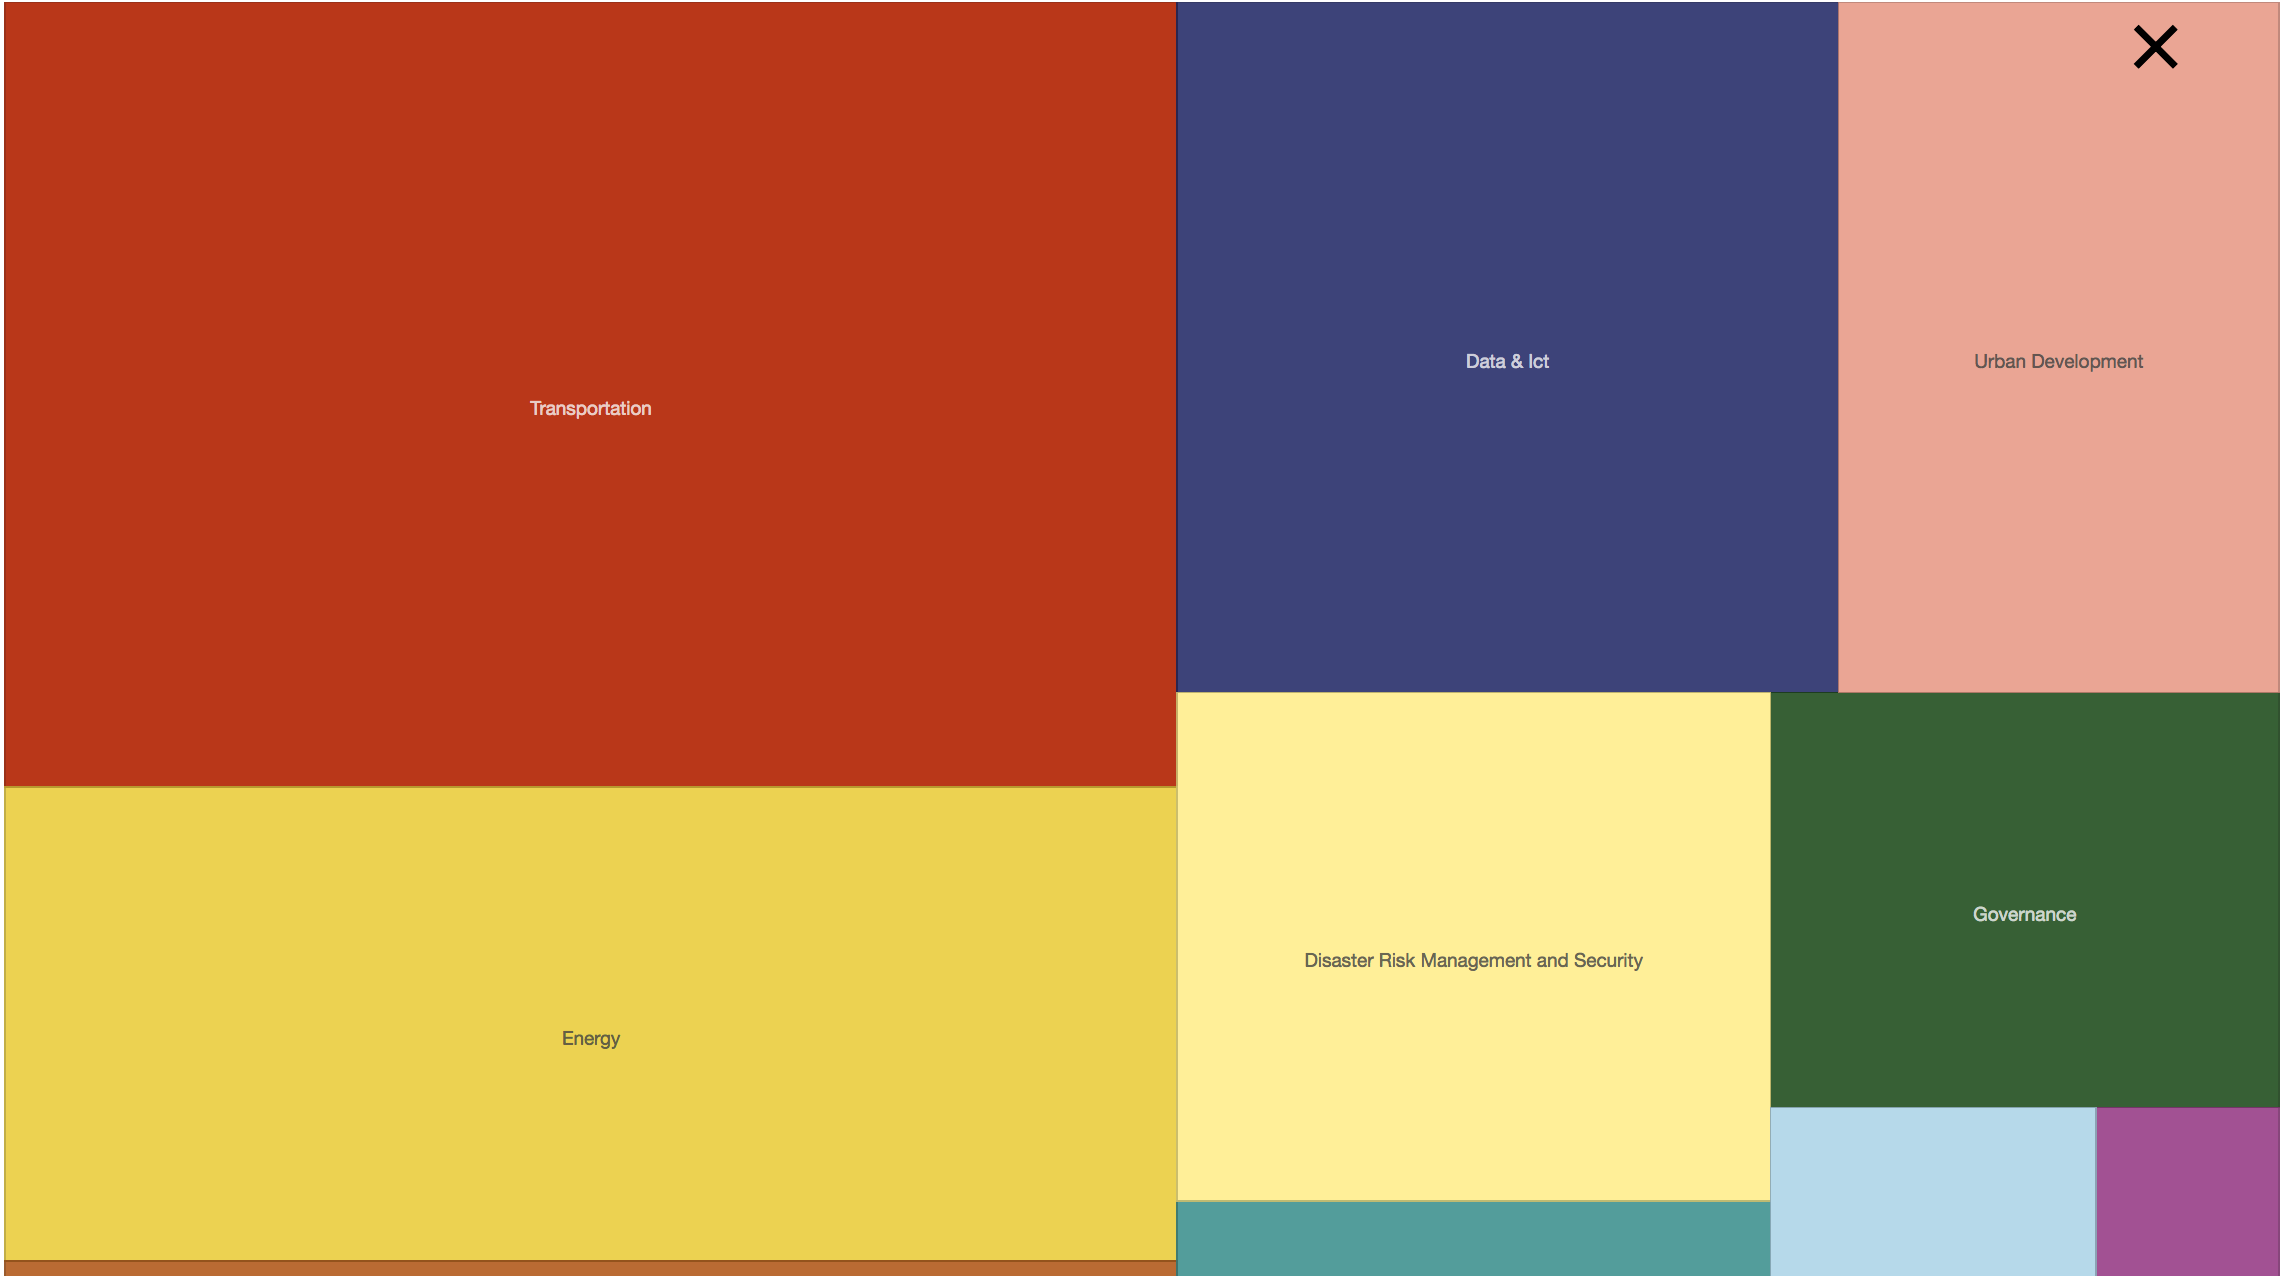
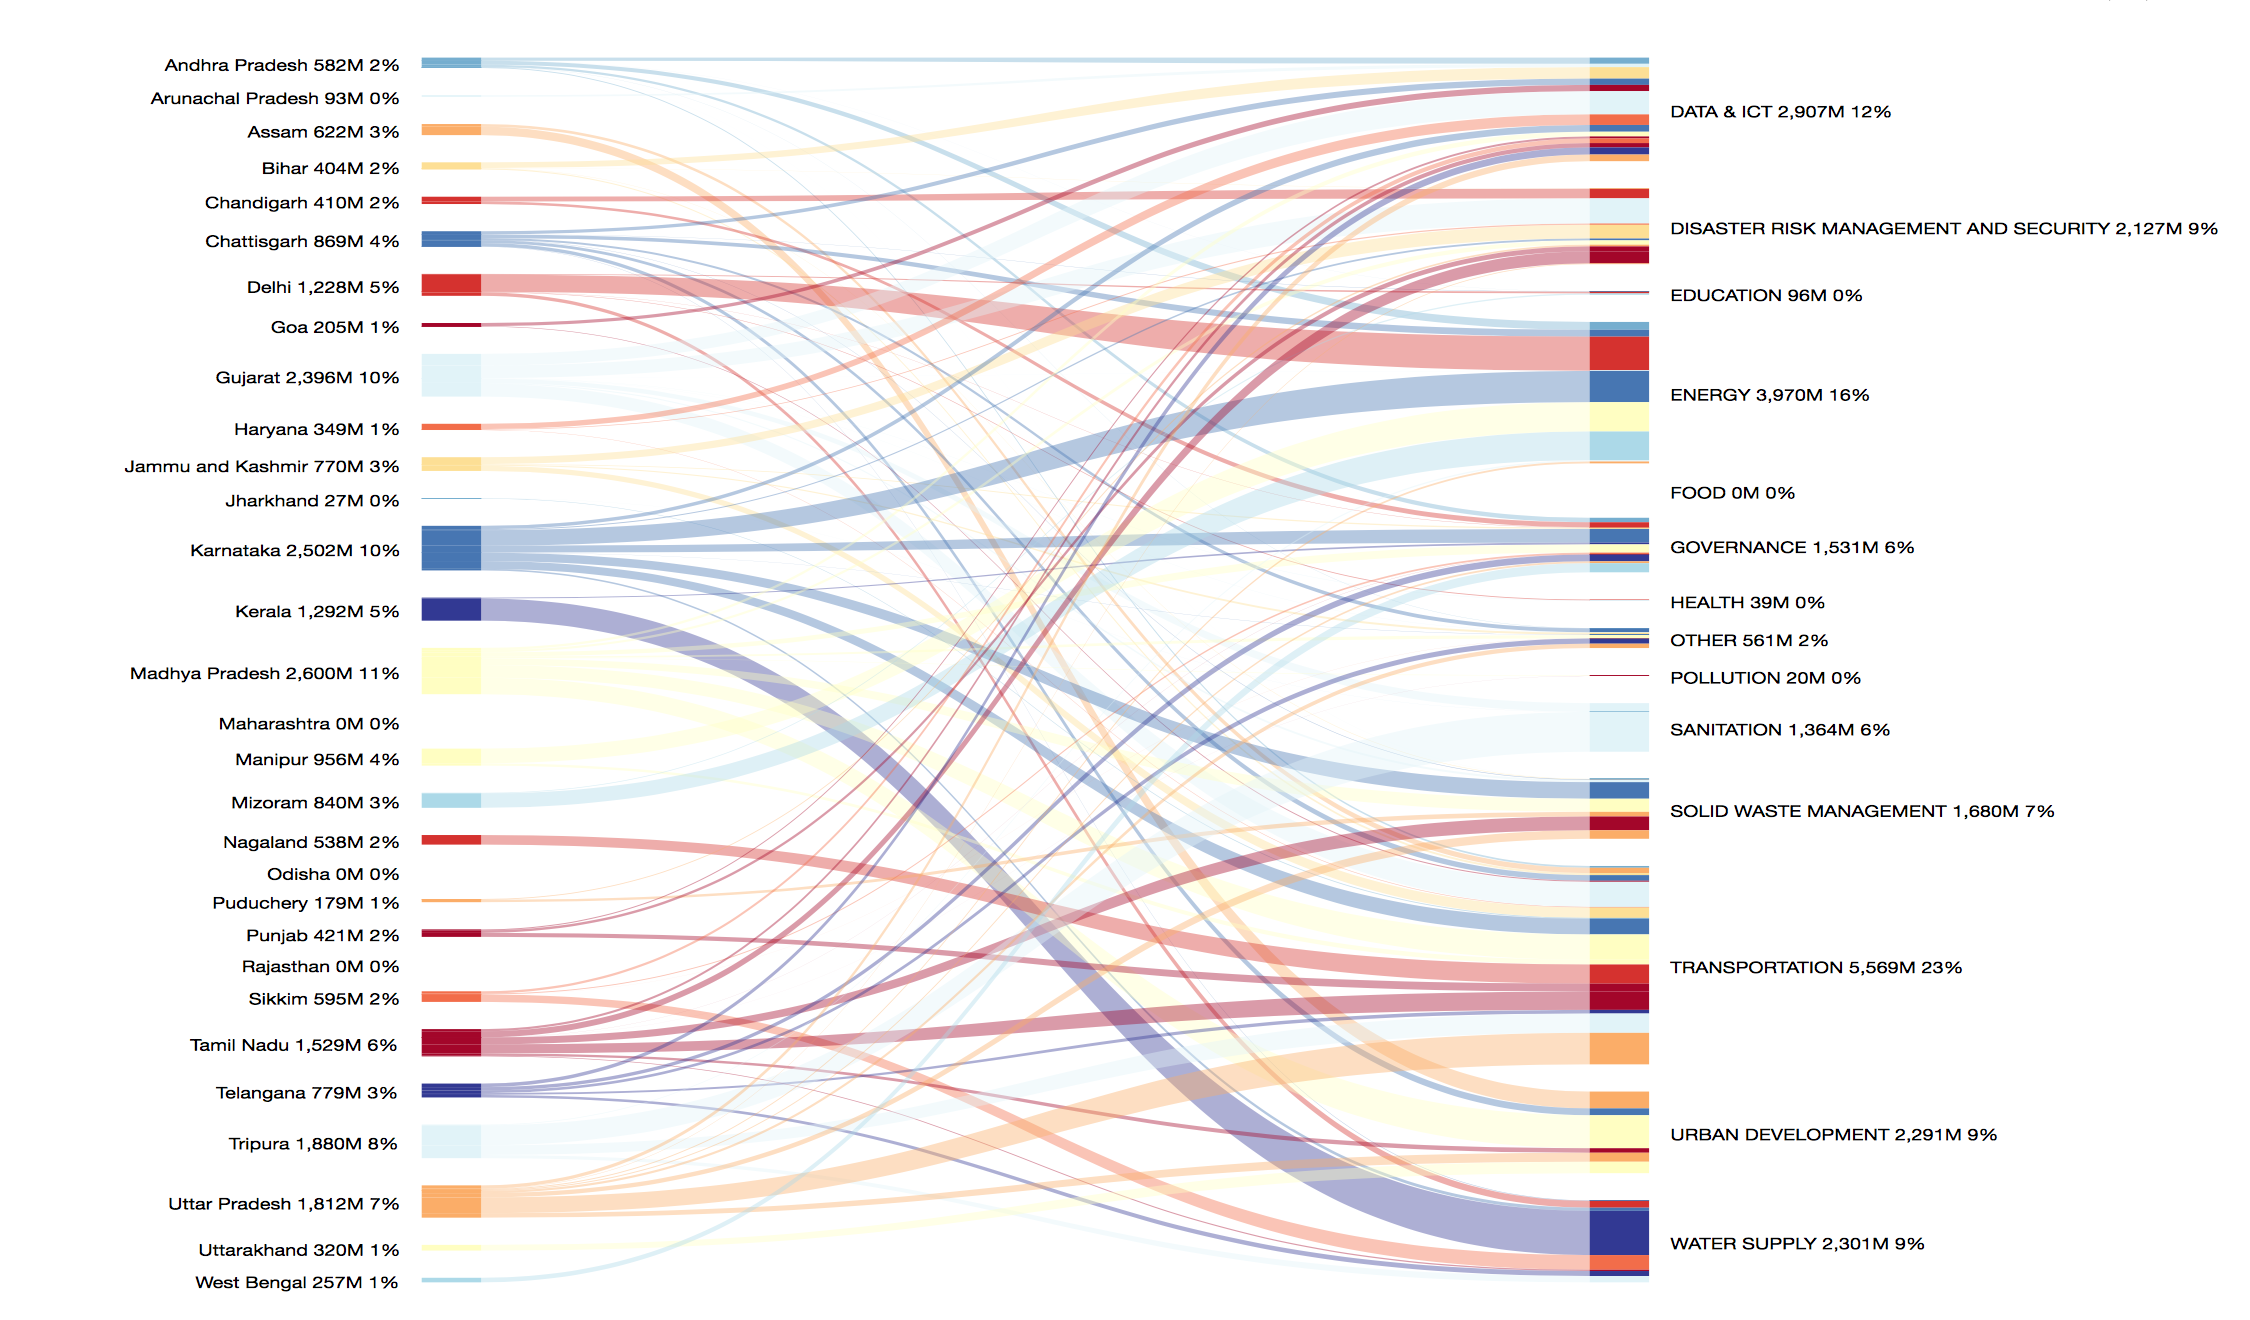
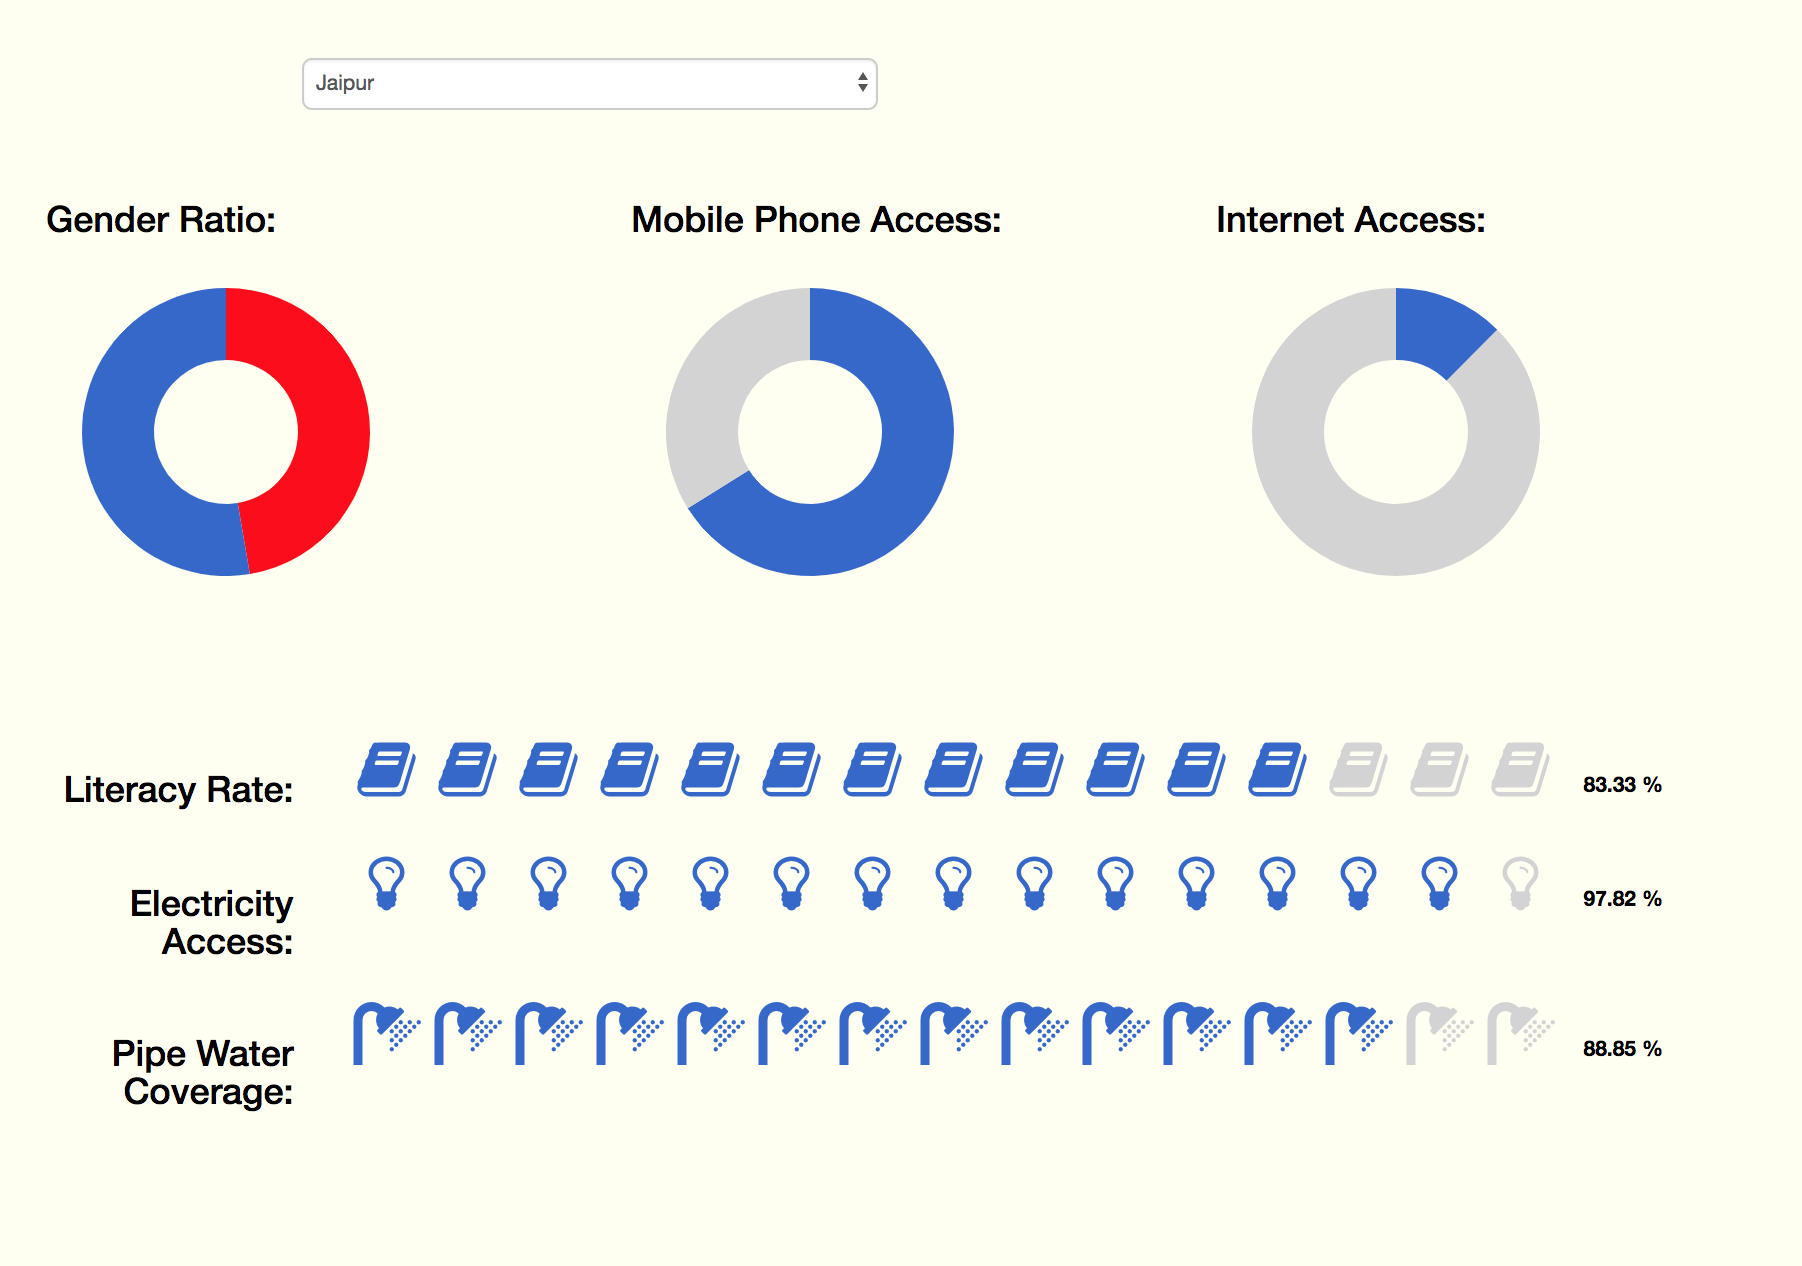
The effort is developing Smart City profiles for each city (see example for Chennai).

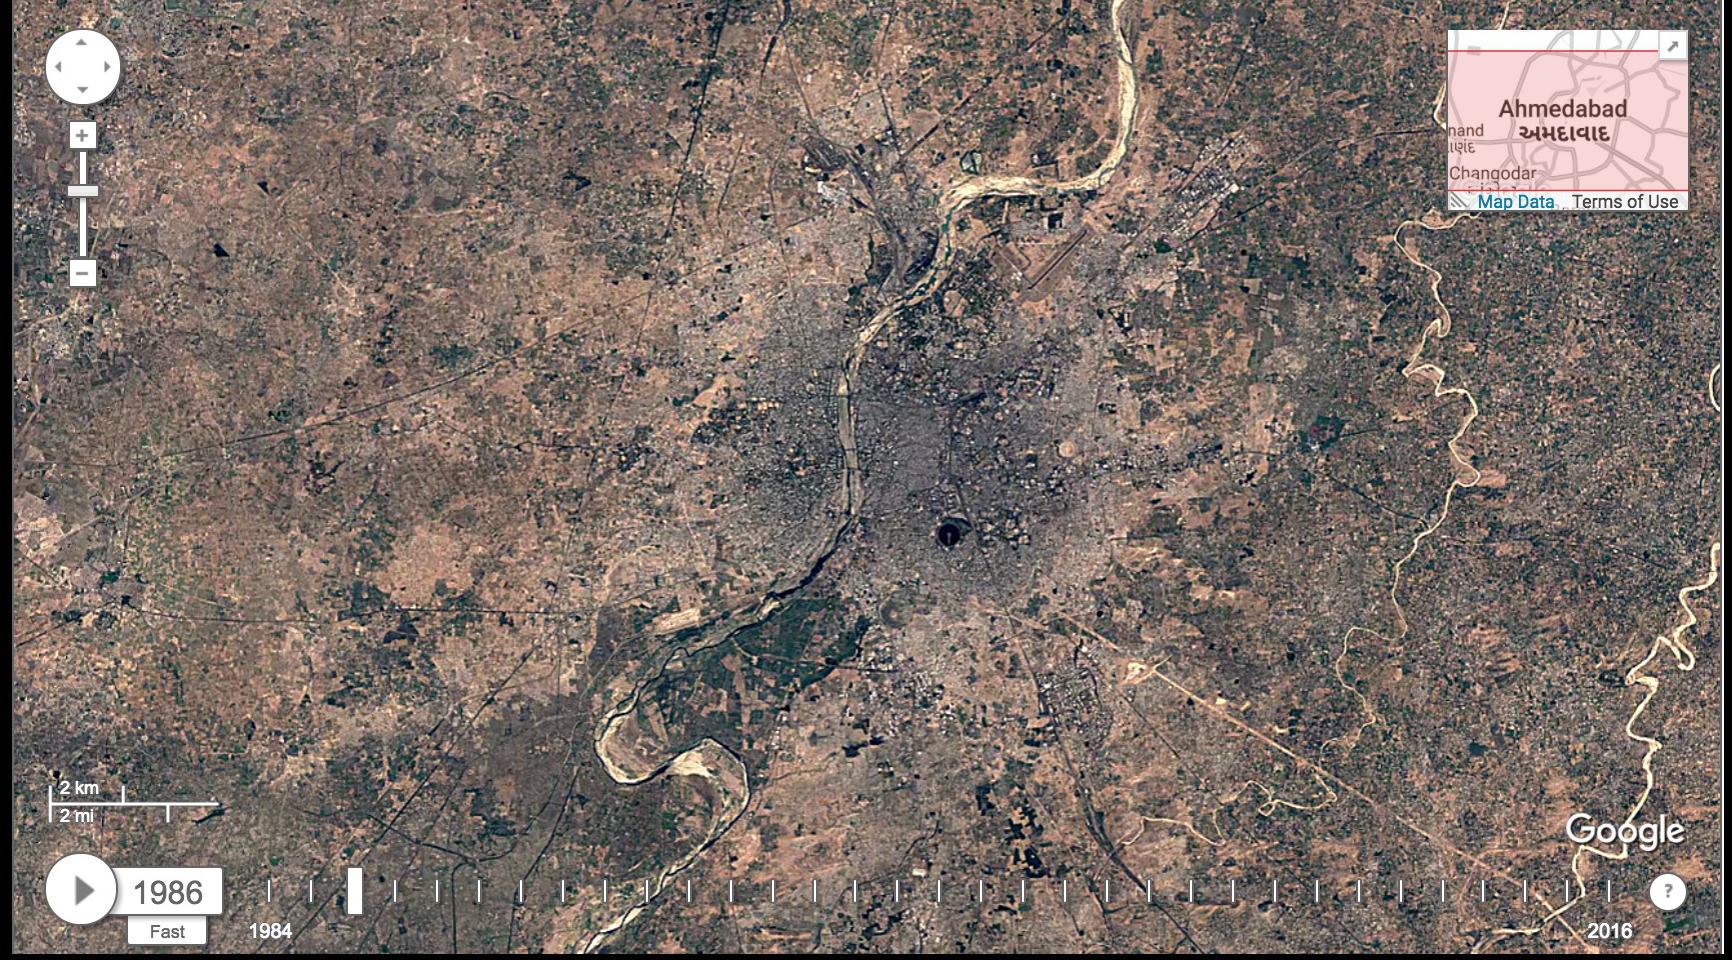
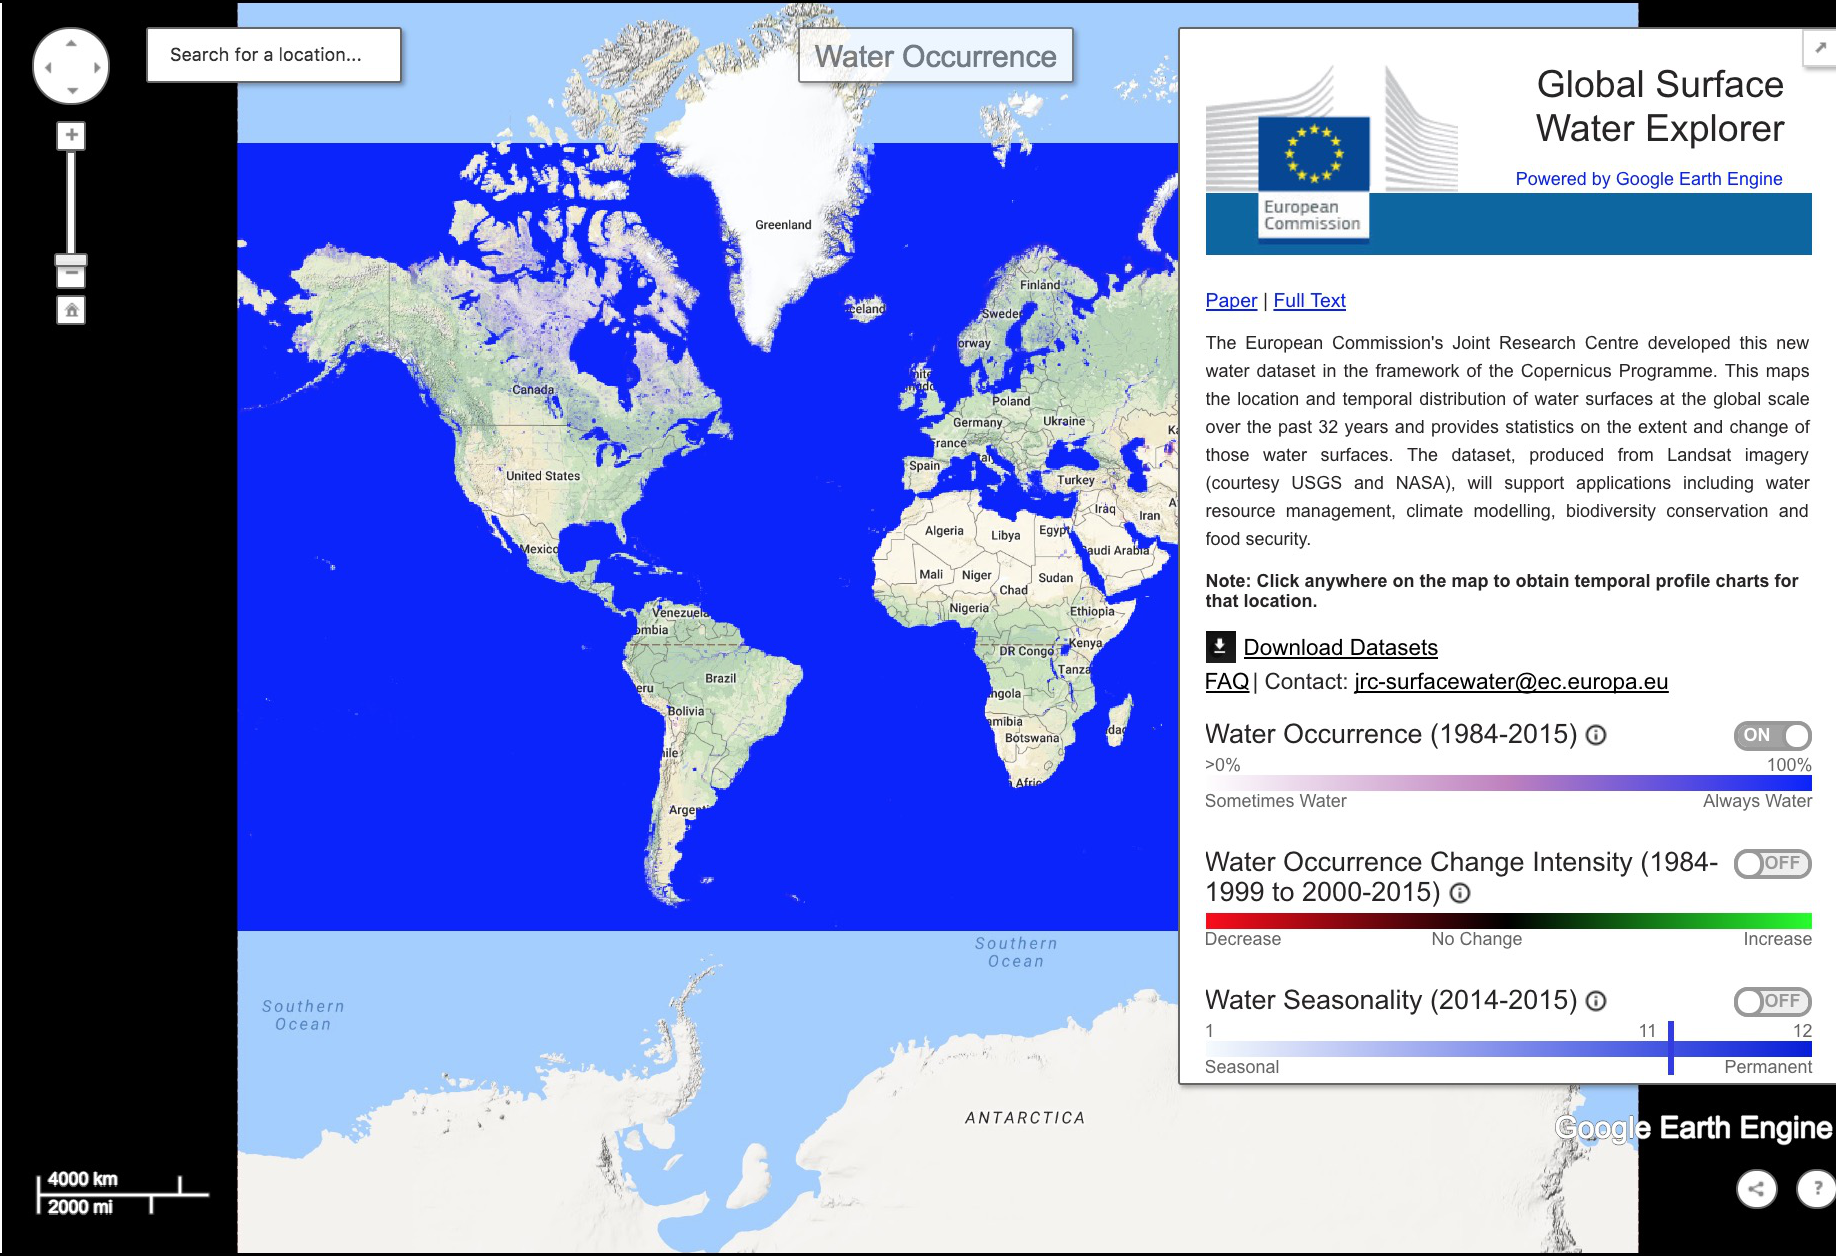
These cities are growing rapidly as can be seen by animating high resolution satellite imagery (please note the animation below based on Google Earth Engine currently only works on computers and not mobile devices):


ICT in Smart Cities

The World Bank (with financing from the Korea Green Growth Trust Fund) is working to support the Government of India in an effort to stimulate the consideration of enhanced ICT aspects as one aspect of a smart city program. This effort will explore various aspects of ICT use in city planning and management.

See examples of how information collected through various sources (e.g. in-situ sensors or earth observation) can be put together to provide a spatial perspective of cities. Many of the products painstakingly analyzed or compiled by different global and local knowledge providers can be integrated to provide a comprehensive overview of these cities – not only from a local context but from a global context.

Some illustrative visualizations are below:


Dropping groundwater levels near cities and large groundwater-dependent agricultural areas (click on any area to see data from the GRACE satellites):
Poor air quality in Indian and Chinese cities as compared to the rest of the world (compiled in quasi real-time from government sensors)
A range of climate risks threaten these urban areas in India. Drought impacts many areas across India


Flood events and impacts are widespread especially in the Ganges-Brahmatpura-Meghna basin.
Risk of Drought
Risk of Cyclone


See the power of cloud computing in this innovative view of the world’s water dynamics, analyzing 30m Landsat data with Google Earth Engine to determine the monthly and annual variations in water occurrence at any location that you click on
For real-time flood information based on satellite analysis, see this interactive map from The Dartmouth Flood Observatory.
Such earth observation data is also being used for projecting flood potential using different techniques, as shown in in this live interactive map with NASA products.


Water risks are often highly dependent on the landuse and precipitation regimes of various areas as can be seen from this Available Water map.
These risks vary over space and time as can be seen using the World Resources Institute’s Aqueduct Water Risk Atlas.
Road transport is often a major growing concern in every city. See the transport network in any city based on crowdsourced data.


The congestion on these roads can be estimated by the power of analyzing cellphone data in real-time to give “live” traffic maps to identify congestion hotspots.
Personal safety is a major concern – see crowdsourcing efforts such as from the Red Dot Foundation (Safecity) that crowdsources live information about harassment.

There are a growing number of online resources that provide information on Indian cities that could be useful in the smart city context. Some of these include:


As India makes the journey from villages to towns to cities, there is a need to better embrace these emerging innovations (e.g. in sensors, earth observation, cloud analytics, data visualization/data science, citizen science, IoT, etc.) in order to modernize the way in which cities are developed and managed.