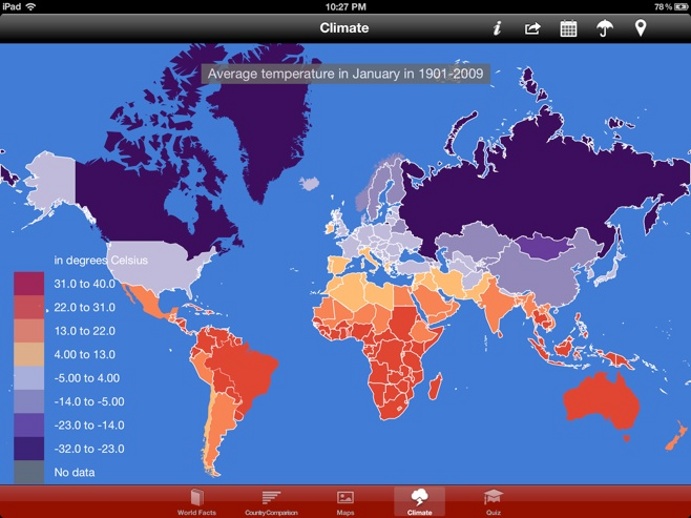
Climate
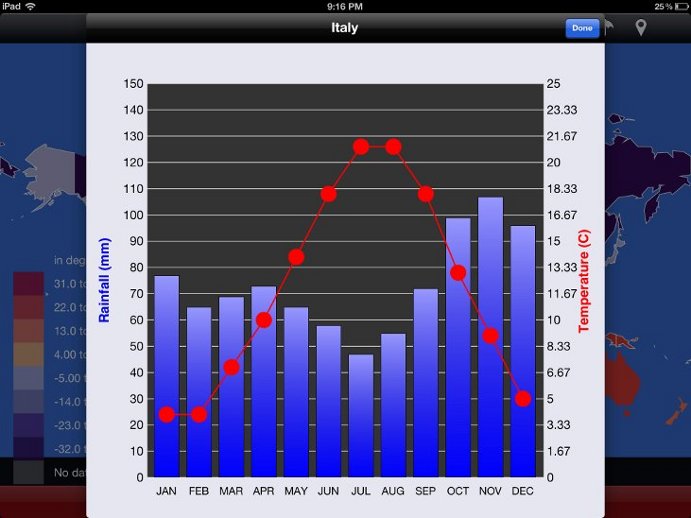
Average temperature and average precipitation are shown on a map. Different colors correspond to temperature or precipitation ranges as shown in the map legend. Switch between temperature and precipitation charts with the 'Thermometer/Umbrella' button in the toolbar. Select the month with the 'Calendar' button. You can zoom into different regions with the 'Location' button. Send the chart by email with the 'Action' button.