Combining Earth Observations to Gain a Global Perspective

Like parts of the human body, Earth’s “spheres” (e.g., atmosphere, hydrosphere, and biosphere) interact with one another in complex ways. For example, Earth’s weather and climate systems are fundamentally linked and impacted by interactions with the ocean and land.

a. Earth’s spheres as an integrated system:

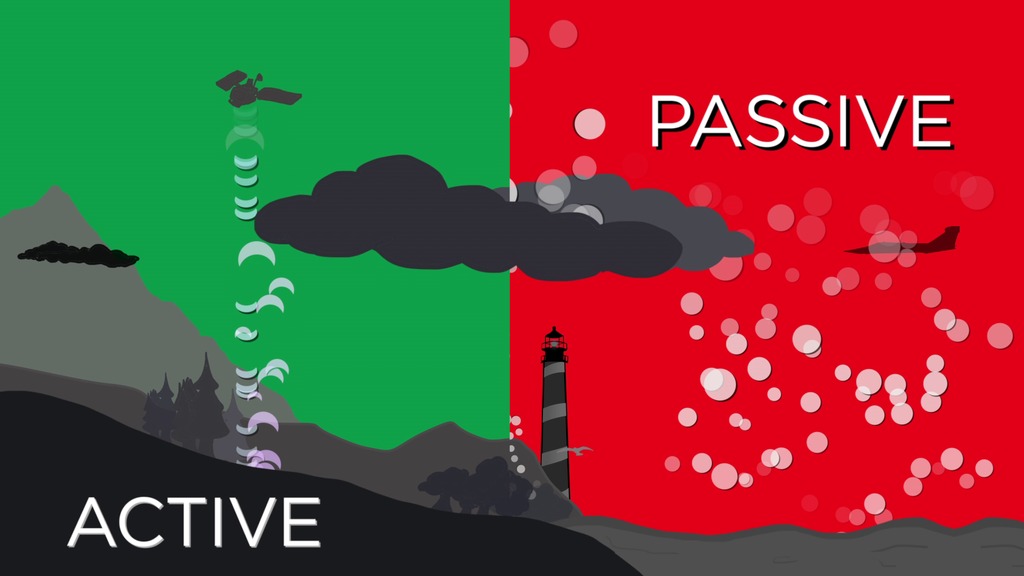
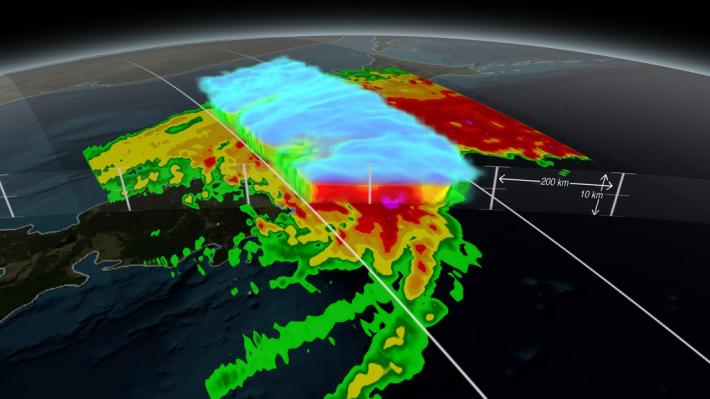
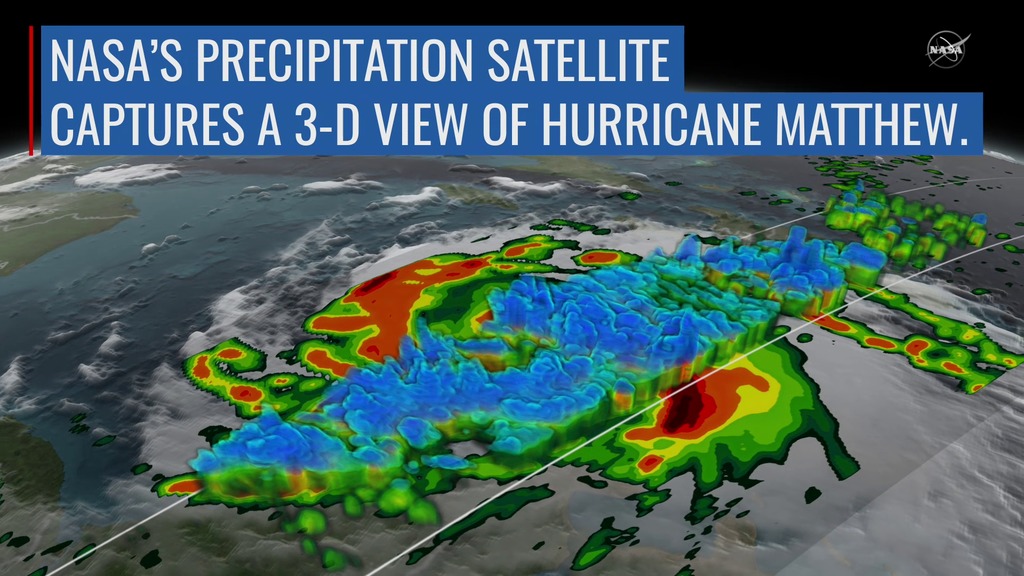
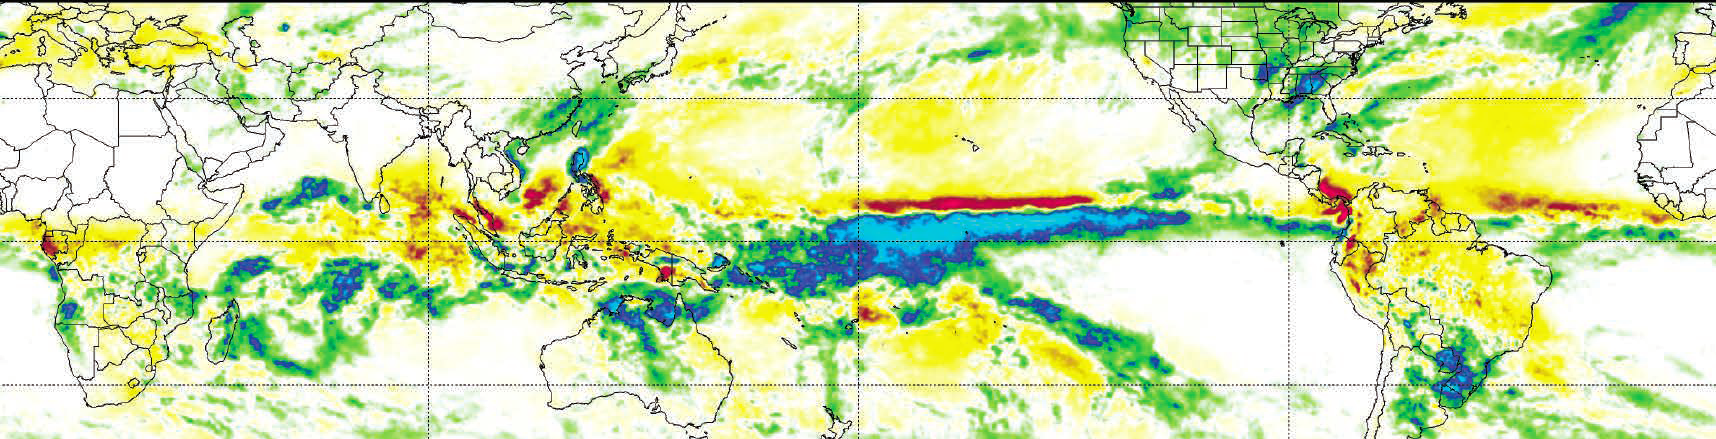
To understand Earth as an integrated system, NASA collaborates with its domestic and international partners to support satellite missions and field campaigns that measure various environmental parameters on a variety of spatial and temporal scales. These observational data, coupled with numerical computer models, increasingly allow scientists to better comprehend interactions between Earth’s components, or “spheres,” and more accurately model weather and climate scenarios such as extreme weather events (e.g., hurricanes) and El Niño.


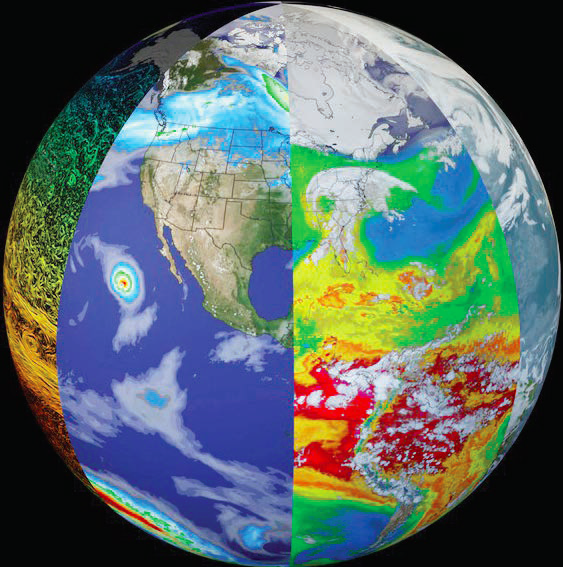
While scientists learn a great deal from studying individual Earth components, improved observational and computational modeling capabilities increasingly allow them to study the interactions between these interrelated environmental parameters, leading to unprecedented insight into how the Earth system works—and how it might change in the future.


Play

b. Hurricanes:

For example, to study hurricanes, scientists use data from a suite of instruments that orbit Earth on several spacecraft to collect information about different aspects of the storm, such as sea surface temperature, humidity, rainfall rates, cloud heights, and surface wind speed. Observing these contributing factors helps scientists to better understand the processes involved in storm formation, movement, and intensification. Furthermore, scientists can ingest datasets such as these into computer models that allow operational forecasters to better predict where, when, and how strong a hurricane may become.


View of Typhoon Phanfone being scanned through the center of the DPR data showing the inner volumetric rain rates. Note: Tokyo is immediately to the left of the scan. Oct. 15, 2014

Play

c. ENSO Patterns:

The ability to observe global precipitation also enables scientists to better understand large-scale climate phenomena such as the El Niño-Southern Oscillation (ENSO) cycle. The ENSO cycle describes the fluctuations in ocean temperature in the equatorial eastern Pacific Ocean. The two modes of this oscillation, El Niño and La Niña, impact global weather patterns and can bring severe drought conditions or intense rainfall events to different parts of the world. While the overall global total rainfall changes very little, global observations of precipitation can show how precipitation is redistributed to specific areas.


This image shows rainfall anomalies for the 30 days ending January 3, 2016—during the strong 2015-16 El Niño. Rainfall anomalies reveal where the rainfall is above (blue shades) or below (red shades) average. The data were computed from the international constellation of precipitation-relevant satellites, numbering about 10 during this time.


d. Monsoon Onset:

Monsoon probably is the most prominent weather phenomenon for the people living in the subtropics because monsoon precipitation, in particular, flood or drought, may have a tremendous effect on agriculture and human lives. Over Asia there are two well recognized monsoon systems, the Indian Monsoon and the China Monsoon. Though Monsoon occurs seasonally resulting from the thermal contrast between the land and the surrounding oceans, its time of onset, area affected, and intensity vary yearly. To accurately predict the monsoon is of vital importance since preventive measures may reduce loss of life and ameliorate economic loss.

Example 1: On June 8 the weather agency of India (IMD) declared the arrival of the 2016 Southwest Monsoon over the Indian state of Kerala. GPM IMERG data was able to observe the onset of possibly wetter India monsoon. An animation of weekly rainfall totals was derived from NASA's Integrated Multi-satellite Retrievals for GPM (IMERG) data. It shows the encroachment of monsoon rainfall onto India's southwestern coast. Rainfall totals were color enhanced in this animation. Lower rainfall totals are displayed in green and higher amounts, reaching over 600 mm (23 inches) per week, are shown in light purple. Extremely heavy rainfall is also shown by IMERG along the coasts of Bangladesh and Burma (Myanmar) on the northeastern side of the Bay Of Bengal.

Play