Precipitation Data in the Real World

Humans are directly impacted by changes in precipitation on a range of scales. For example, an increase in rainfall can cause flooding and/or landslides that affect individual homes, cities, or even entire countries. Flood disasters and torrential rainfall can also have negative health impacts, such as increasing the spread of diseases like malaria. Drought conditions can impact a region’s susceptibility to wildfire or diminish crop yields for local farmers—both of which can have cascading effects on the local to regional economy. Access to accurate estimates of precipitation can improve our understanding of growing seasons or indicate where international organizations agencies should deliver aid. Among other uses, precipitation and other Earth-observing datasets from NASA are used for forecasting tropical cyclones; monitoring soil moisture conditions and freshwater availability; and monitoring flood and drought conditions, landslide activity, crop yields, and water-related illnesses.

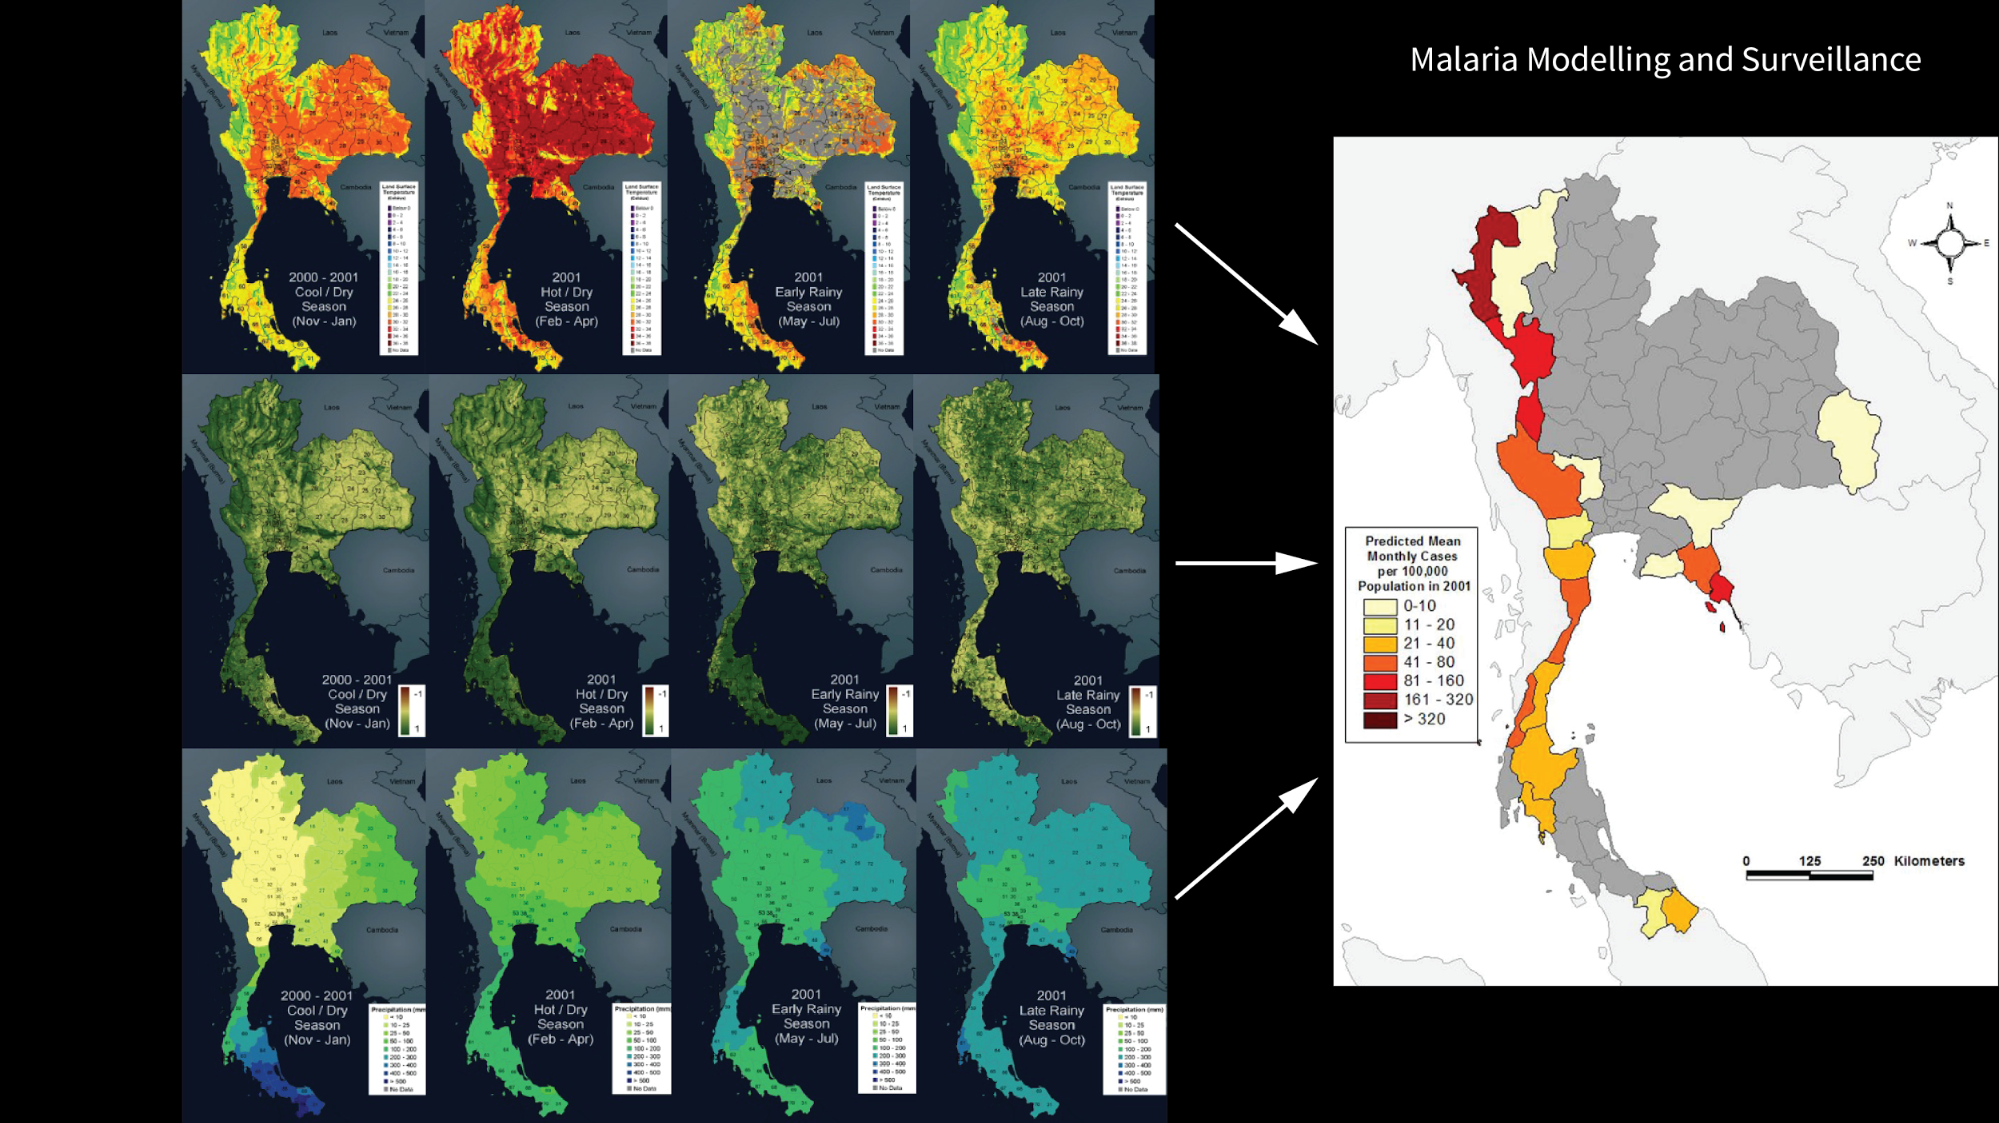
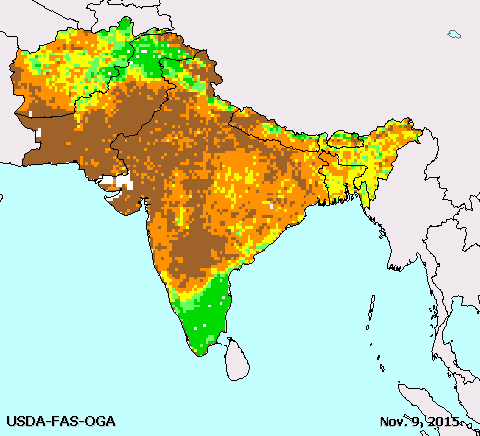
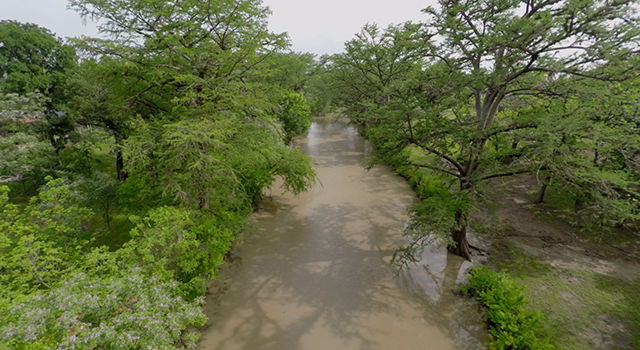
Characterizing the surface and weather conditions that can lead to flooding is often difficult due to a lack of ground-based information available to monitor or forecast flood events (particularly in developing countries). To fill some of these data gaps, scientists and forecasters often rely on satellite sources as inputs to hydrologic models that can predict where the water will likely flow once it hits the ground. While the majority of flood models currently focus on local or regional scales (taking into account one drainage basin or watershed) some recent research has shifted to estimating areas of potential flooding on a global scale.

Example 1 - Floods: The Global Flood Monitoring System (GFMS) is a NASA-funded experimental system that uses real-time satellite precipitation data as part of their flood monitoring and prediction tools. The model combines the satellite precipitation data with a hydrologic model, which includes information about the types of soil, soil moisture, vegetation, slopes, rivers, and streams as well as other factors that affect whether an area will flood. The end product is a series of estimates describing potential flooding conditions that are produced every three hours around the world. Data can be accessed through the Global Flood Monitoring System. Starting with the 1/8th degree resolution maps, users can "zoom in" to regional areas, change which parameter to view, time sequence the maps over the last few days or months, and select a latitude/longitude location and plot time sequences of data at a point. Once sufficiently "zoomed in"(~10° latitude window is recommended) on the 1/8th degree maps, one can select from the 1 km resolution parameters (streamflow, water storage,inundation map) for a high resolution view of the regional basin. Time sequences at this high resolution of the map can be viewed and time series at a point can also be plotted by clicking the mouse at the location. The global flood potential map can also be accessed through https://pmm.nasa.gov/precip-apps, where users can select the global flood layer in addition to rainfall accumulations from 30 minutes to 7 days.


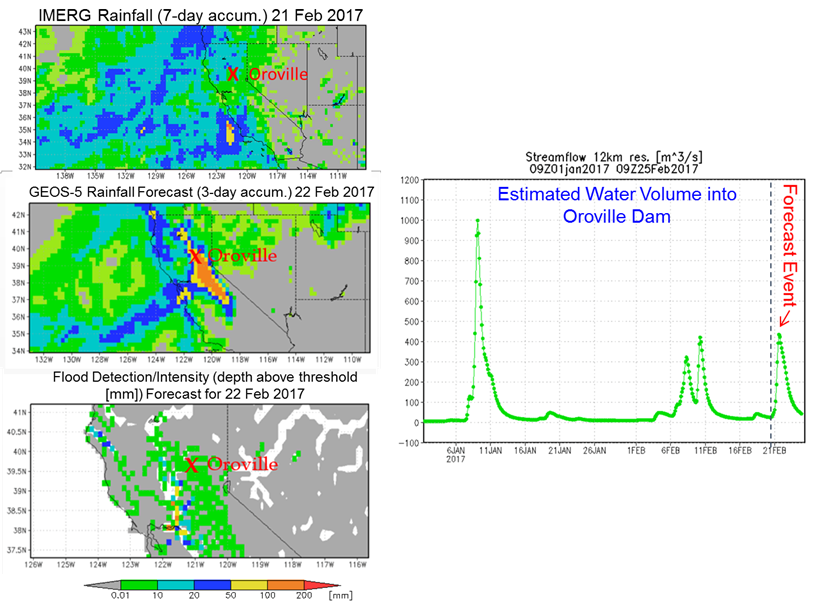
GPM data is used by the Global Flood Monitoring System (GFMS) to detect potential flooding conditions and estimate intensity. This system also uses GEOS-5 precipitation forecast to estimate streamflow within affected areas. Top left shows the 7-day GPM rainfall totals over California ending on 21 Feb. 2017. Middle left plot shows forecasted 3-day rainfall from the GEOS-5 model near the Oroville Dam area. Bottom left plot shows the forecasted flood detection/intensity for 22 Feb. 2017, forecasts over northern California are estimated to be over 200 mm for the 22 Feb. 2017 (bottom). This information is valuable for improving situational awareness of floods. This capability can be applied anywhere globally, especially where conventional data and methods are not available.


Example 2 - Fires: The Fire Weather Index System is the most widely used fire danger rating system in the world. The Global Fire WEather Database (GFWED) https://data.giss.nasa.gov/impacts/gfwed/ developed at NASA GISS integrates different weather factors influencing the likelihood of a vegetation fire starting and spreading. Calculations require measurements of temperature, relative humidity, wind speed, daily snow-depth, and precipitation totaled over the previous 24 hours. GPM data, along with other satellite, gauge-based, and model products are incorporated in different versions of the GFWED and are used by fire management agencies around the world. This data is open to the public and can provide improved situational awareness of potential fire danger around the world.


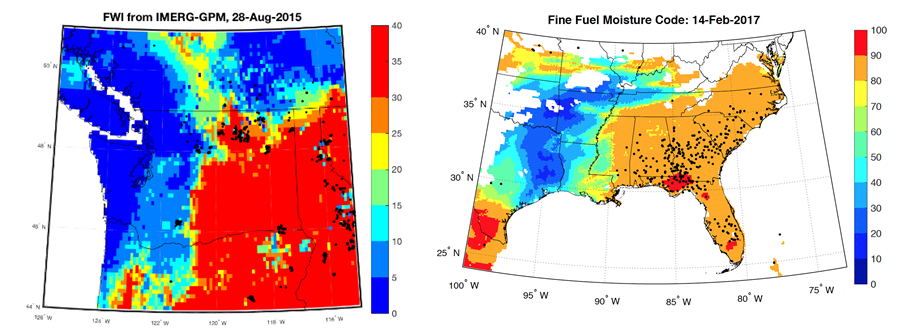
The Fire Weather Index tracks the potential for extreme fire behavior, shown here with Aqua & Terra MODIS active fires using GPM data for Aug 2015 record-breaking Pacific Northwest wildfires (left). The Fine Fuel Moisture Code tracks the potential for fire starts, such as these predominantly agricultural and forest plantation prescribed fires in the southeast US (right).


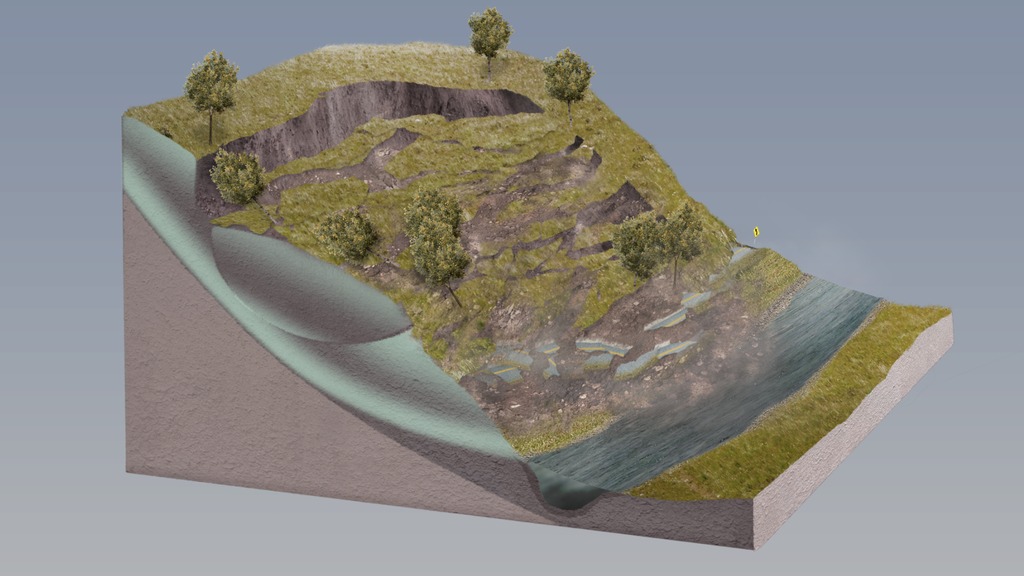
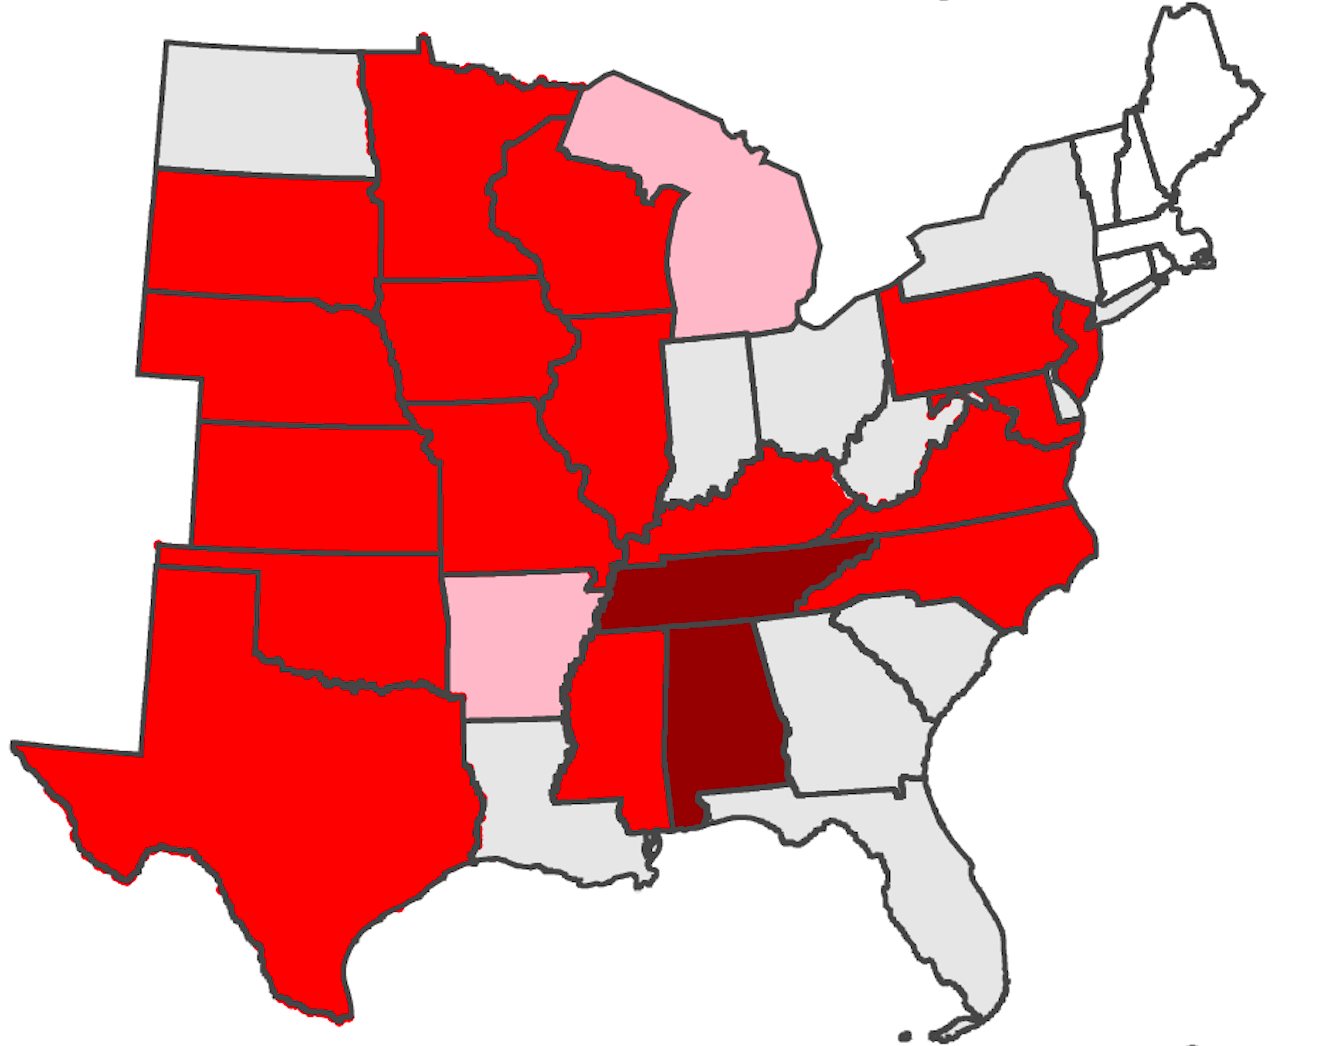
Example 3 - Landslides: A global landslide nowcast model provides situational awareness of landslide hazards for a wide range of users. The model uses GPM near real-time rainfall data with a global susceptibility map (available here: https://pmm.nasa.gov/applications/global-landslide-model) to identify locations with landslide potential. This model is updated every 30 minutes and the data is accessible via Applications Programming Interface at and interactive map at https://pmm.nasa.gov/precip-apps. NASA landslide susceptibility, hazard, and rainfall data are available globally in near real-time and have been used by many international and domestic organizations, such as the World Bank, World Food Programme, Pacific Disaster Center, FEMA, and the US Army Corps of Engineers.


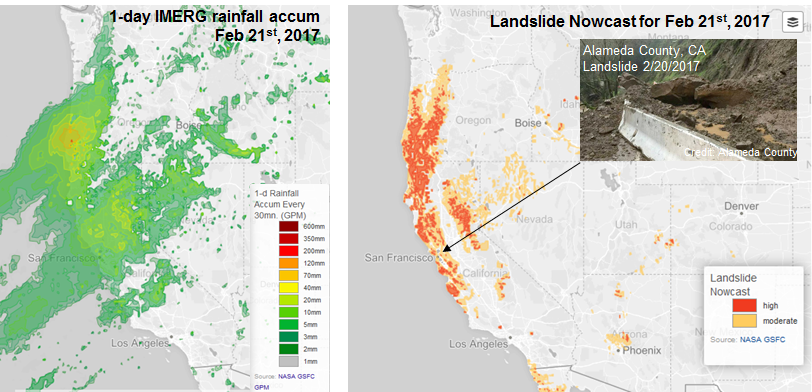
1-day GPM IMERG rainfall accumulation (left) for the U.S. West Coast and corresponding landslide nowcasts (right) are shown for Feb. 21st, 2017. Results are updated every 30 minutes and data is available at https://pmm.nasa.gov/precip-apps.


Play

b. Tropical cyclone tracking and weather prediction:

Example 1 - Cyclone tracking: The Naval Research Lab (NRL) routinely uses GPM Microwave Imager (GMI) data along with other sensors in their Automated Tropical Cyclone Forecasting System for improved storm track prediction. The NRL’s forecasts are used by weather prediction and disaster response organizations around the world.


Hurricane Matthew affecting Nassau in the Bahamas as a Category 4 storm on 10/6/2016.


Play

Malaria outbreaks after the 2010 floods in Pakistan; E. coli and coliform outbreaks from raw sewage in Mississippi flood waters; and cholera spread by heavy rains in Cameroon, West Africa are among the many health hazards associated with flood disasters and torrential rains. In developing regions with limited or vulnerable clean water infrastructure and health resources, any improvements that increase the lead time for warning systems can make a huge difference in protecting the public. Using satellite data to forecast disease outbreaks is an emerging field.

Example 1 - Malaria Modeling: NASA’s Malaria Modeling and Surveillance (MMS) Project’s Global Situational Awareness Tool (GSAT) combines datasets from a number of satellites, including precipitation estimates, to evaluate the risk of malaria worldwide. GPM’s near-global coverage and high-frequency observations also help locate areas at risk for public health crises caused by short-term events such as hurricane-induced flooding, which can cause sewage and sewage-related health issues. For more information on this work please visit: https://svs.gsfc.nasa.gov/30593.


Example 2 - Cholera Forecasting: Work is being done to estimate the risk of cholera after major triggering events, such as storms, by bringing together satellite precipitation data with air temperature anomalies and population to compute maps of estimated cholera risk. One example is shown for Haiti following the passage of Hurricane Matthew 1-2 October, 2016. The goal of this work is to provide improved situational awareness of potential cholera outbreaks before and after potential events. For more information on this work, please contact Antar Jutla (Antarpreet.jutla@mail.wvu.edu).


Plots show a) GPM precipitation anomalies or deviations from normal conditions prior to and b) following Hurricane Matthew; c) track forecast for Matthew over Haiti, d) shows a Cholera risk map based on pre-hurricane hydroclimatic conditions, e) updated Cholera risk map 2 weeks after Hurricane Matthew, and f) reported cases of Cholera as of 10 Oct 2016.


Remotely sensed precipitation estimates play a key role in monitoring and modeling efforts for organizations that track food and water security, like the Famine Early Warning Systems Network (FEWSNET). In addition to the amount and distribution of seasonal rainfall, the timing of the onset of rainfall is an important variable for early estimation of growing season outcomes like crop yield. With their global coverage, satellites can also observe the results of natural disasters such as short- and long-term droughts, floods, and persistent or deficient snow cover that can each affect agricultural productivity. Satellite precipitation estimates from GPM, combined with other environmental datasets, are used to determine the extent and availability of surface rainfall over farm and ranch land within the U.S. Air Force Weather Agency’s AGRicultural METeorology (AGRMET) model. AGRMET analyzes and forecasts rain and snow estimates to use within hydrologic models. Data from NASA’s Soil Moisture Active Passive (SMAP) mission (and other satellite sensors) can provide additional information on how much water is in the soil, which is useful for assessing drought and flood conditions, and estimating groundwater supplies

Example 1 International Agricultural Forecasting: The International Production Assessment Division (IPAD) is the agricultural forecasting division of the Office of Global Analysis (OGA) within the U.S. Department of Agriculture’s (USDA) Foreign Agricultural Service (FAS). IPAD is responsible for providing monthly global crop estimates and projected crop yields to monitor global crop conditions and ensure agricultural economic security. The USDA FAS is working with NASA and other satellite products to improve agricultural productivity forecasting system through providing NASA products, tools and information. Through this effort, the USDA FAS is implementing enhanced surface and root-zone soil moisture products in order to yield improvements in their crop forecasting system. The application of satellite-based soil moisture estimates from the Soil Moisture Ocean Salinity (SMOS) mission into the FAS soil moisture model provides significant improvements to vegetation forecasting skill in several areas of the world, particularly areas lacking adequate rain gauge coverage required to characterize rainfall inputs into a soil water balance model. Since the move to operations in spring of 2014, the USDA FAS has demonstrated improvements in their crop monitoring and forecasting ability after applying the new satellite-based product, particularly in sparsely-instrumented countries with moderate-to-severe food security issues. The system is now being adapted to integrate observations from the NASA Soil Moisture Active Passive (SMAP) mission.


Air Force Weather Agency (AFWA) precipitation artifact carried over to AFWA surfaces soil moisture.


Example 2 - Global Agricultural Drought Monitoring: Accurate, within-season information on factors limiting yield from optimal levels is of significant social benefit, providing essential information on market demand and supply and helping to identify food insecure areas. Current crop production forecasting systems require adequate knowledge of the available soil water in order to properly predict the impact of the in-season weather variations on the end-of-season crop production. Therefore, modeled and remote sensing-based products are an essential source of information which allow for the routine monitoring of moisture availability and vegetation development, particularly over remote areas where ground-based data are limited. The USDA Foreign Agricultural Service is operationally applying NASA’s soil moisture products to monitor global agricultural drought and predict long and short-term impacts on vegetation health and agricultural yields. Merging satellite- and model- based products enable improved estimates of end of season crop yield. These satellite-derived estimates provide equivalent or better of end of season crop yields compared to costly and labor intensive survey-based methods.For more information about the project, please visit https://c3.nasa.gov/water/projects/32/


This image show a screen capture of 10 day average surface soil moisture products posted on the USDA Foreign Agricultural Service (FAS) Crop Explorer website (http://www.pecad.fas.usda.gov/cropexplorer/) for early-November, 2015 (11/01/2015 - 11/10/2015). The image on the top left shows the AFWA precipitation used to generate the model only run shown in the top right plot. The poor precipitation data quality over the region results in limited spatial variability when applied to the USDA FAS soil moisture model. The figure below has improved spatial heterogeneity from the integration of near-real time soil moisture observations from the Soil Moisture Ocean Salinity (SMOS) mission, which were assimilated into the USDA FAS forecasting system soil moisture model using a 1-D Ensemble Kalman Filter (EnKF).


Example 2 - Global Agricultural Drought Monitoring: Accurate, within-season information on factors limiting yield from optimal levels is of significant social benefit, providing essential information on market demand and supply and helping to identify food insecure areas. Current crop production forecasting systems require adequate knowledge of the available soil water in order to properly predict the impact of the in-season weather variations on the end-of-season crop production. Therefore, modeled and remote sensing-based products are an essential source of information which allow for the routine monitoring of moisture availability and vegetation development, particularly over remote areas where ground-based data are limited. The USDA Foreign Agricultural Service is operationally applying NASA’s soil moisture products to monitor global agricultural drought and predict long and short-term impacts on vegetation health and agricultural yields. Merging satellite- and model- based products enable improved estimates of end of season crop yield. These satellite-derived estimates provide equivalent or better of end of season crop yields compared to costly and labor intensive survey-based methods.For more information about the project, please visit https://c3.nasa.gov/water/projects/32/


Average estimates of August 2003-2010 predicted end of the growing season corn yields for the central and eastern U.S. from satellite merged product (left plot) and field survey (right plot) show the performance of state-averaged yield predictions. Better forecast accuracy was achieved over most of Central and Eastern U.S. (red colored states).

Play